Correction: An earlier version misstated parts of the crossover timeline and presented unverified explanations and forecasts as conclusions. This version uses executed statewide grade rows and treats the grade-transition ratios as descriptive comparisons, not evidence of retention, transfers, or dropout.
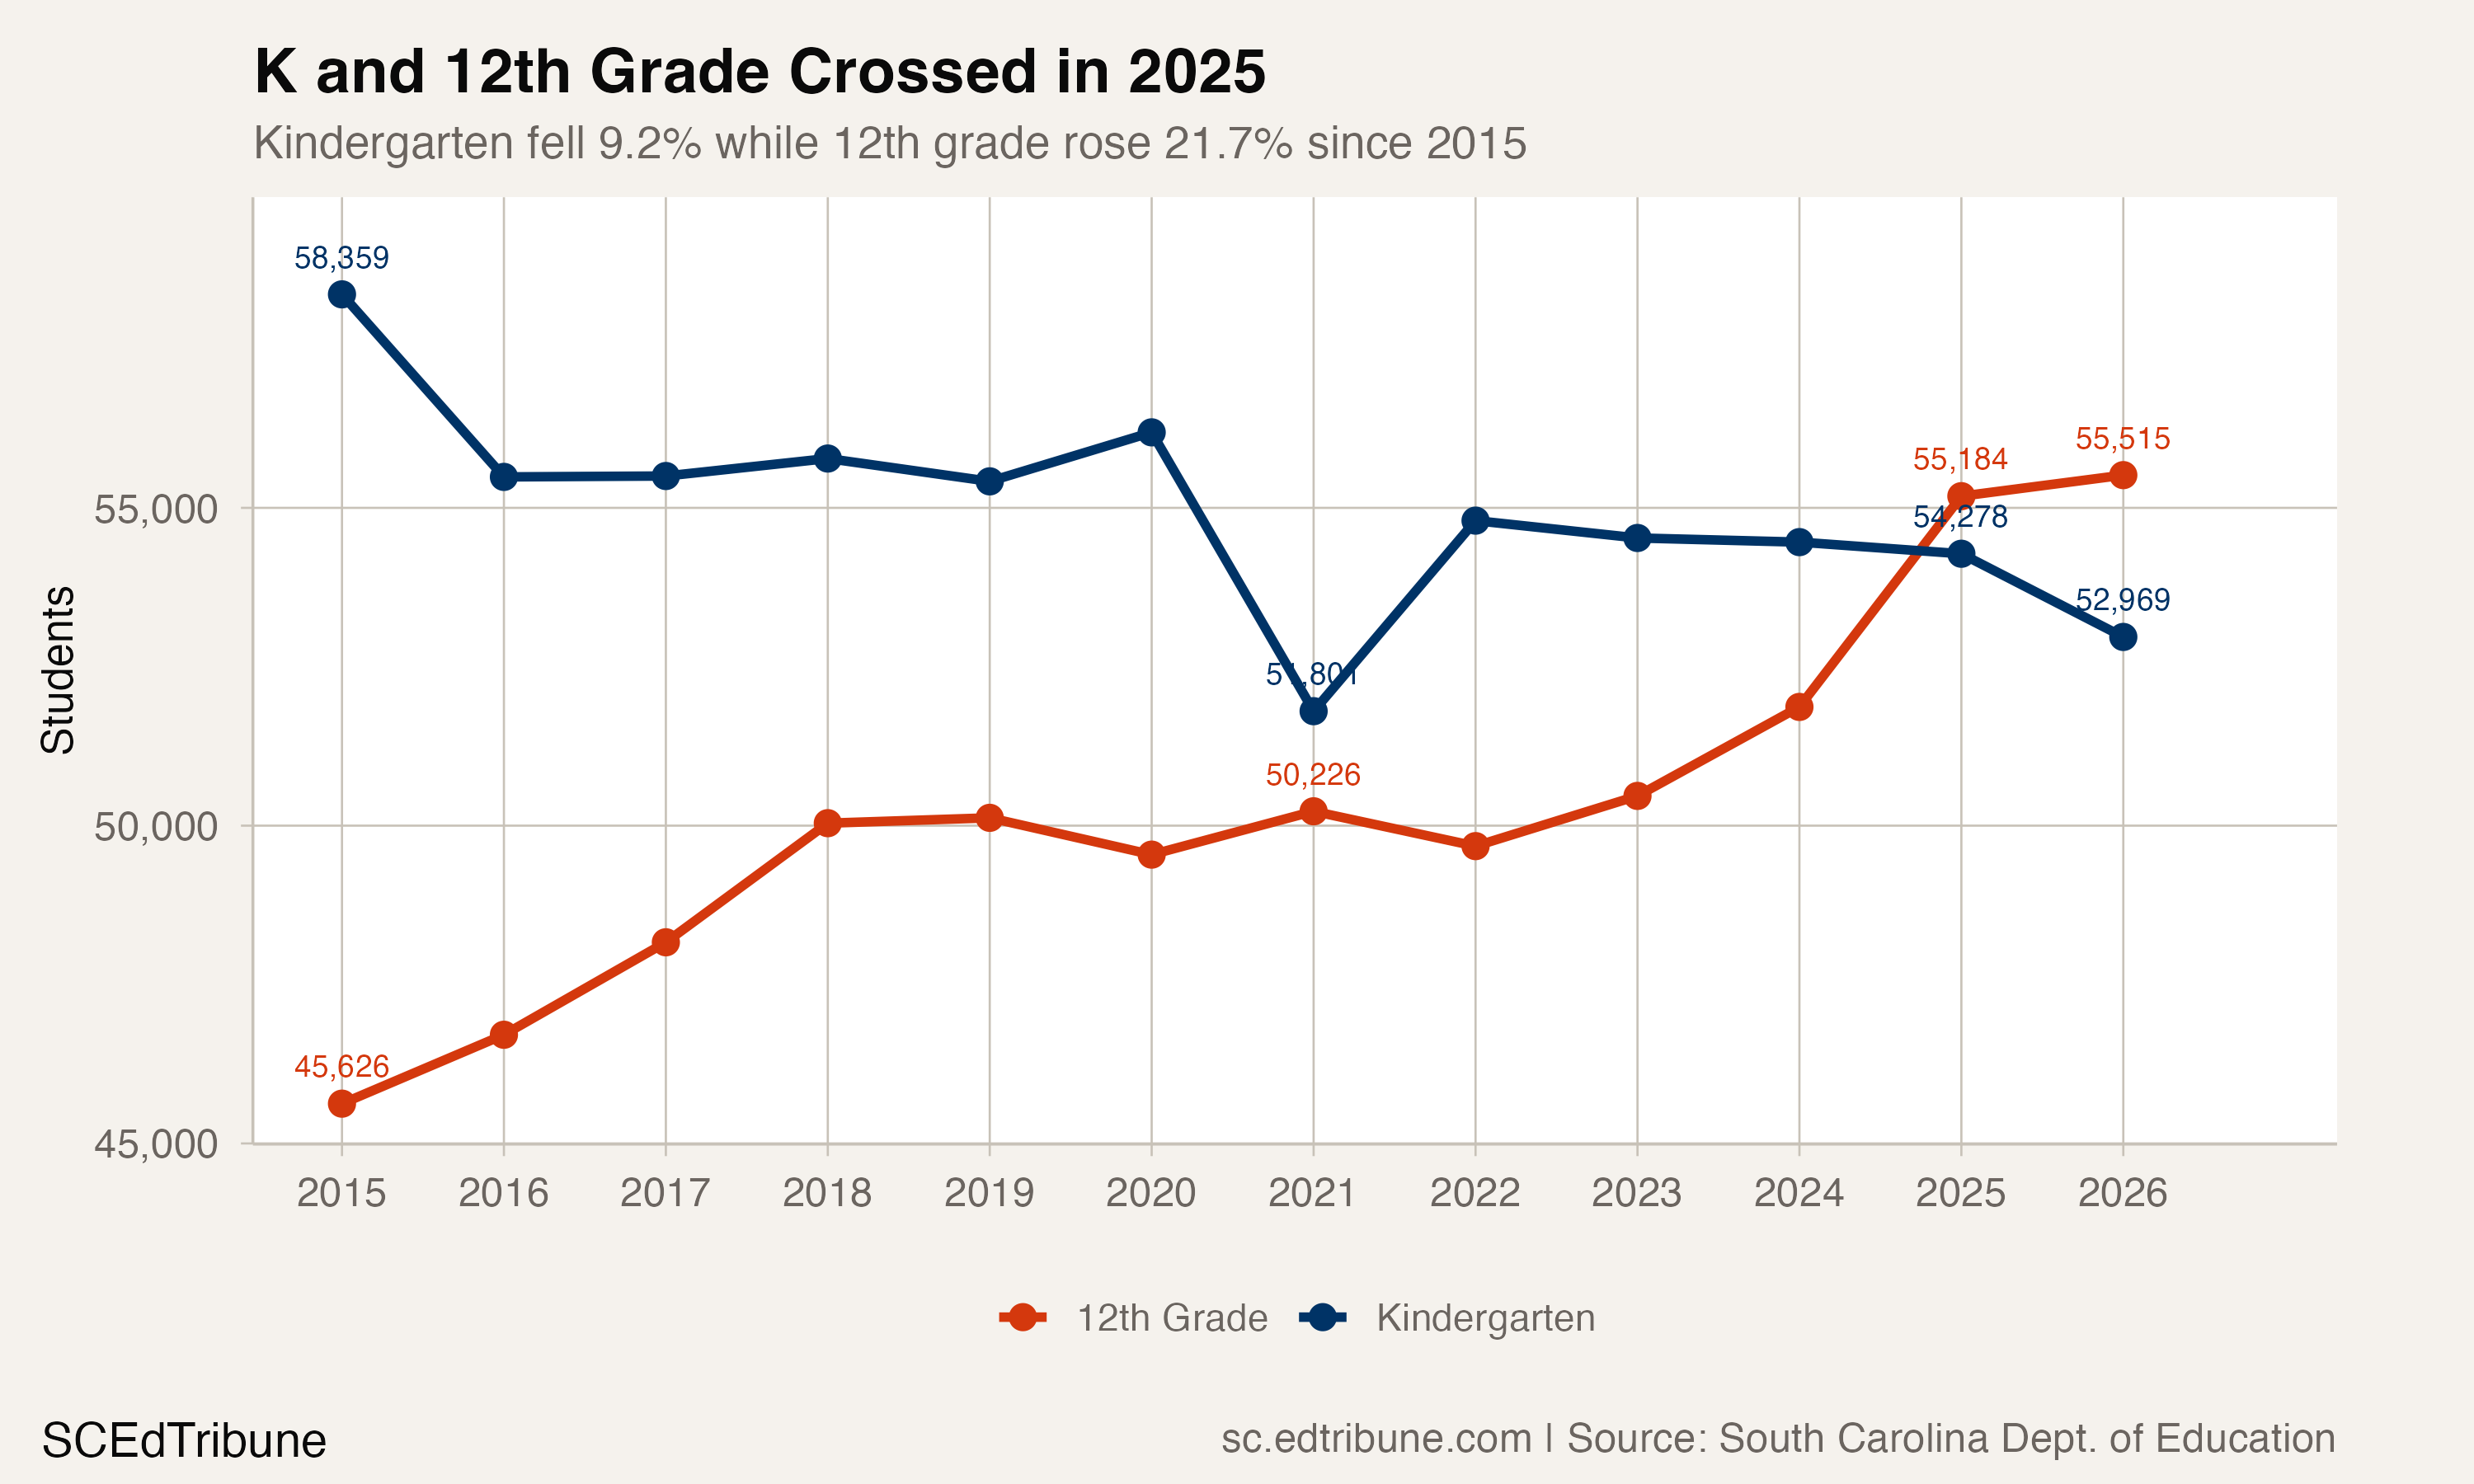
South Carolina enrolled 58,359 kindergartners and 45,626 12th graders in 2014-15, or 127.9 kindergartners for every 100 12th graders. In 2024-25, the ratio fell below 100 for the first time, reaching 98.4.
The difference widened in 2025-26. The state reported 52,969 kindergartners and 55,515 12th graders, a ratio of 95.4 and a gap of 2,546 students.
The endpoint changes moved in opposite directions
Between 2014-15 and 2025-26, kindergarten enrollment fell by 5,390 students, or 9.2%. Twelfth-grade enrollment rose by 9,889 students, or 21.7%.
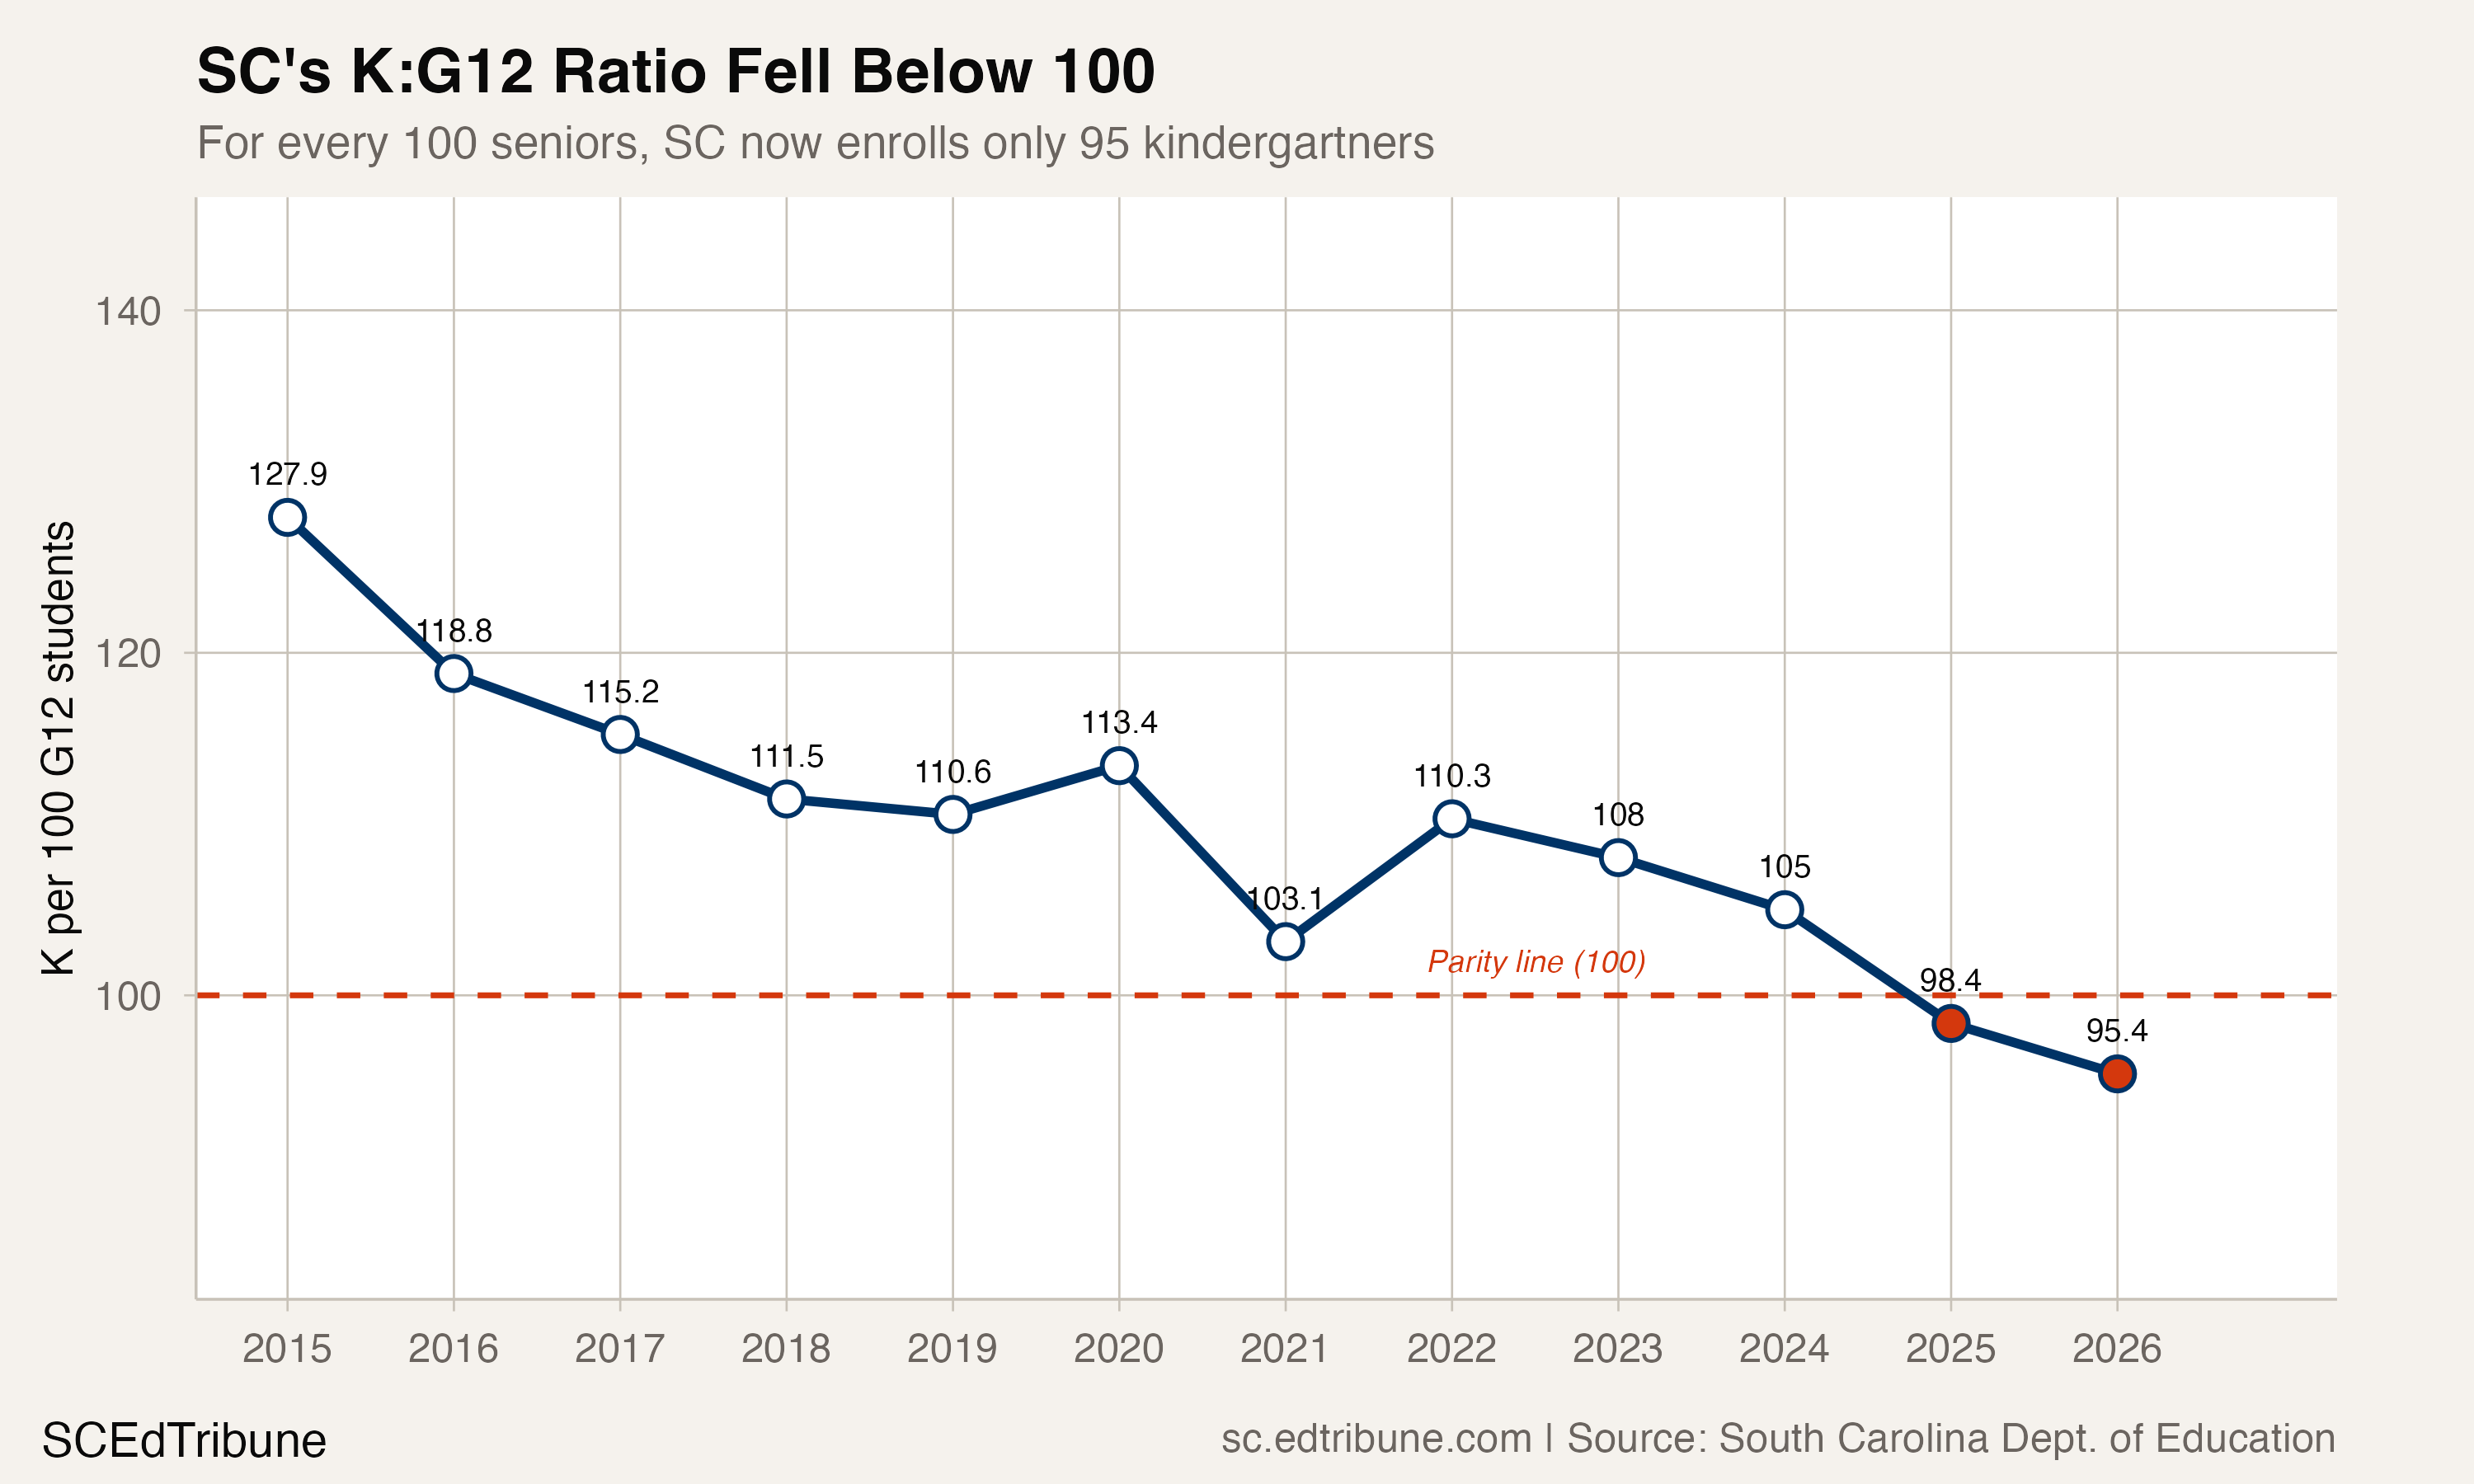
The ratio did not fall every year. The verified result is the endpoint decline and the first below-parity year, not a continuous annual slide.
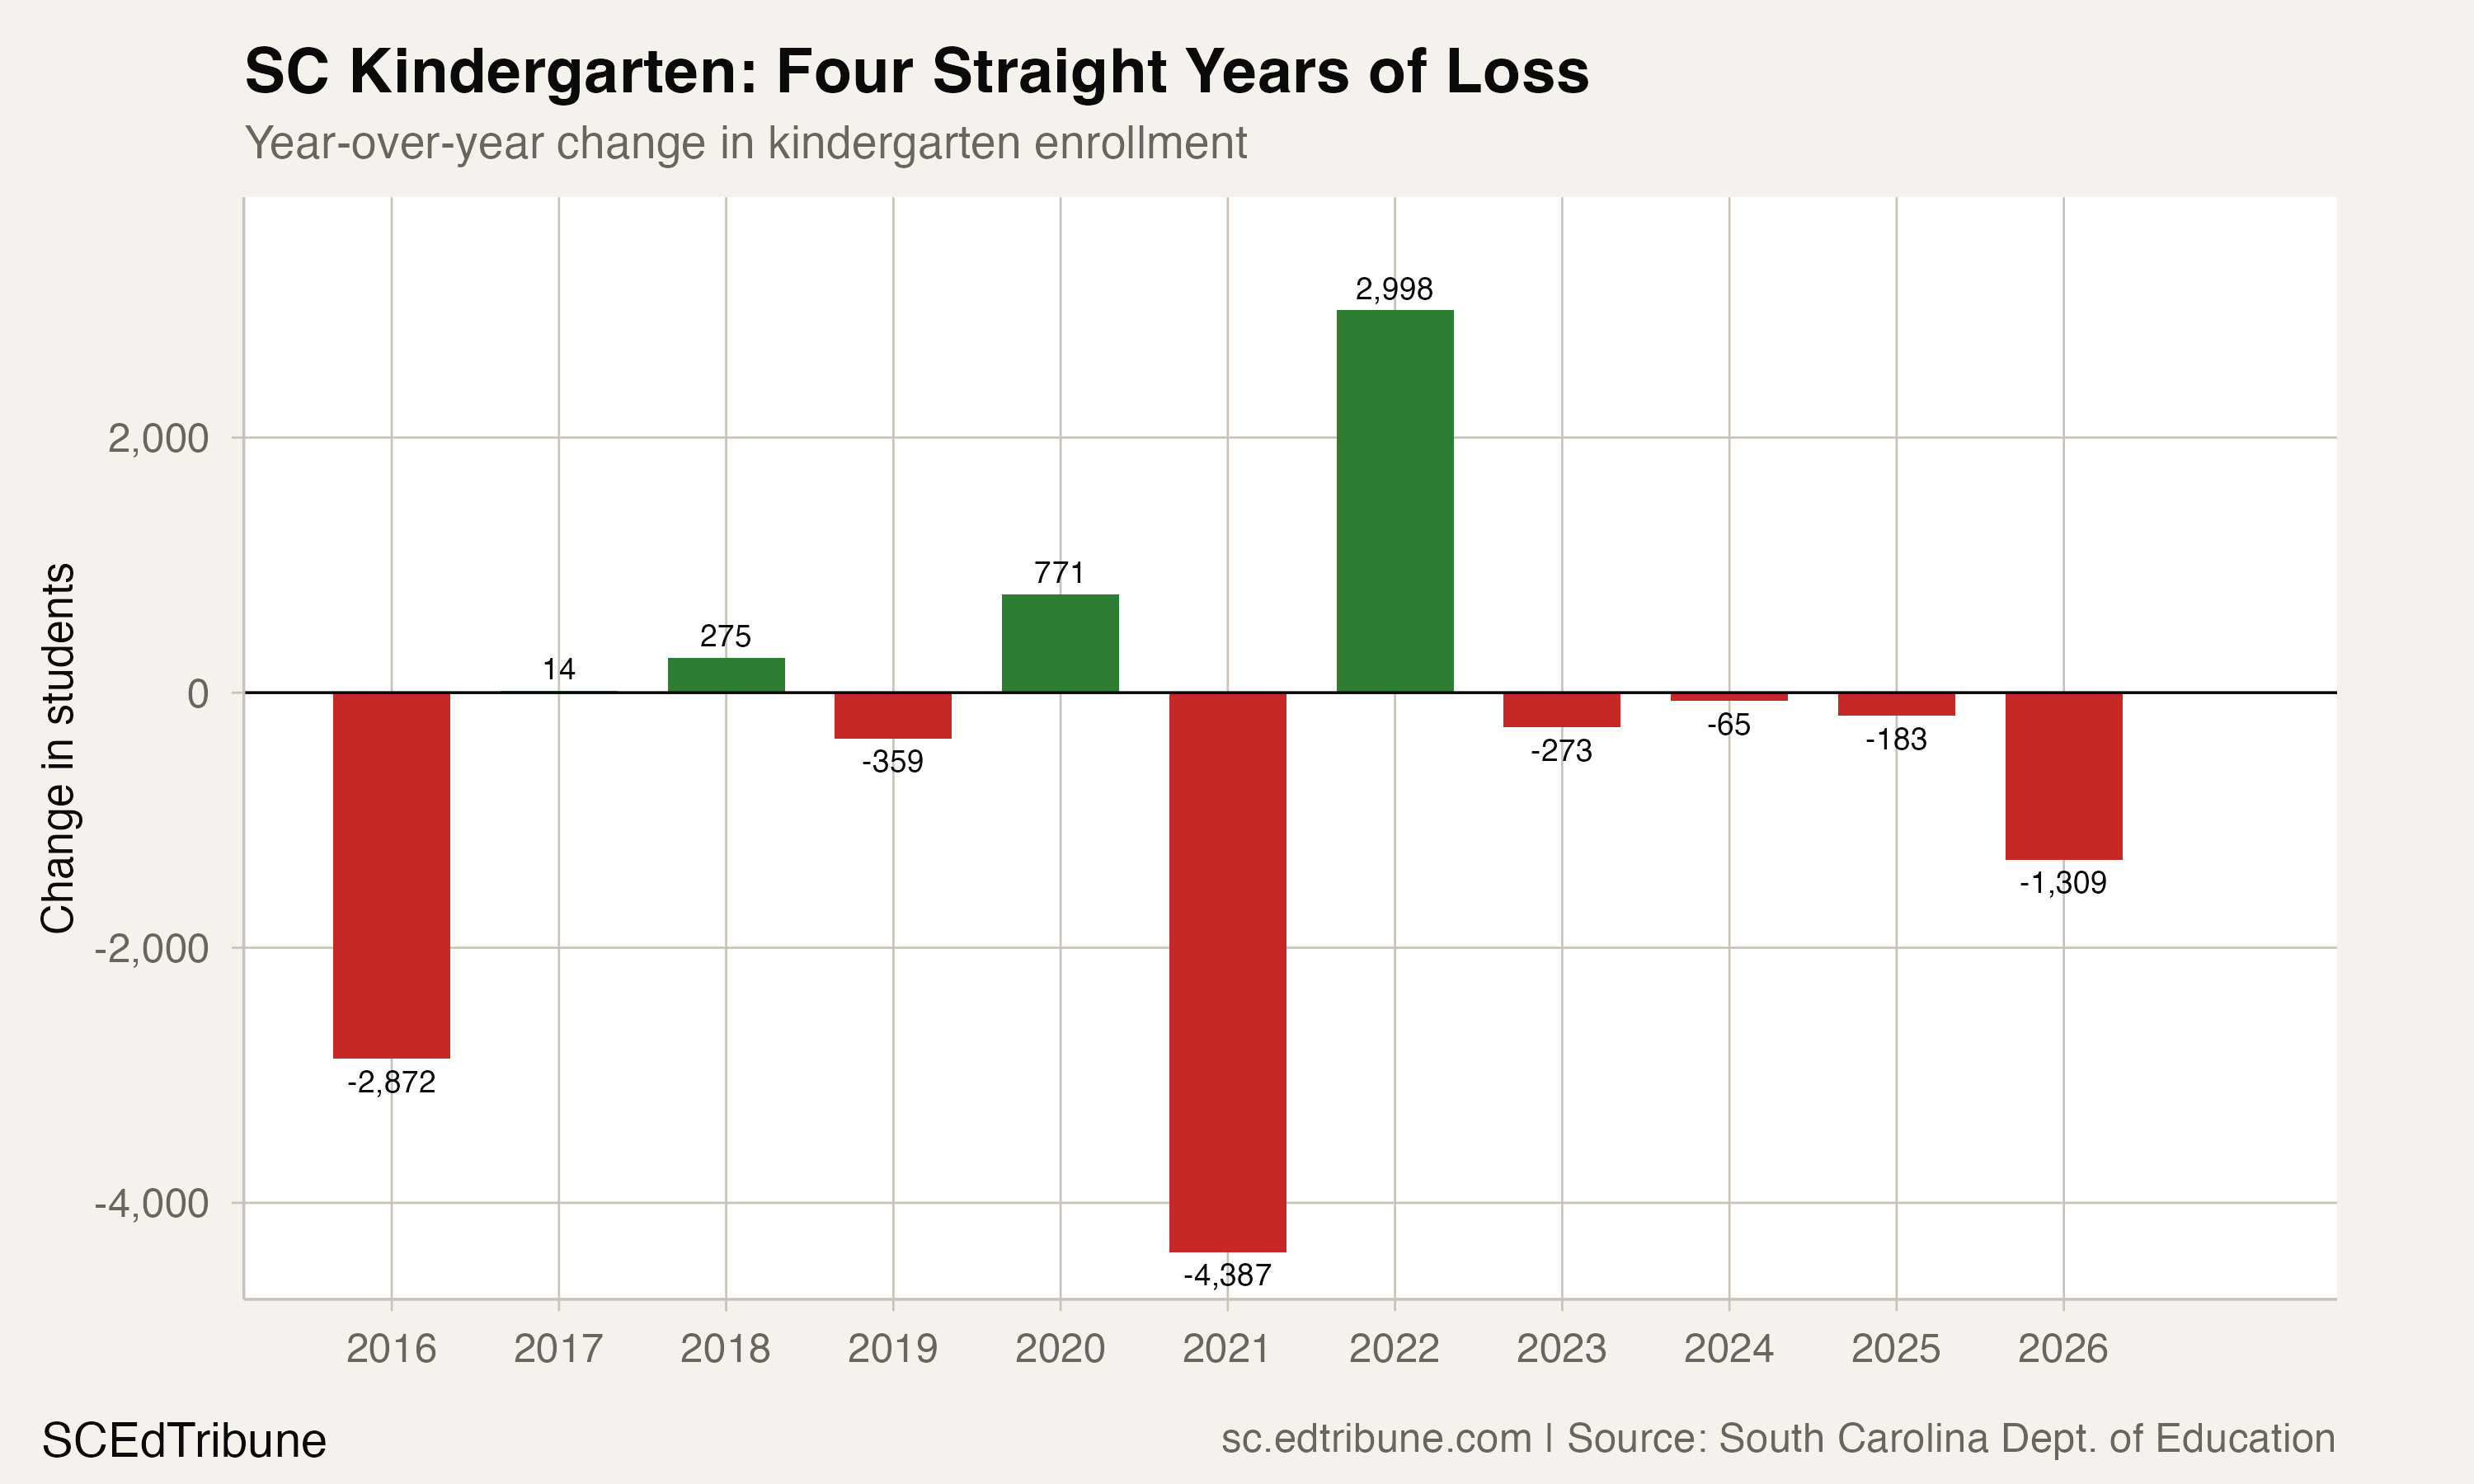
Kindergarten enrollment fell in four consecutive years. The annual changes were losses of 273 students in 2022-23, 65 in 2023-24, 183 in 2024-25, and 1,309 in 2025-26. The latest loss was larger than the prior three losses combined, which totaled 521 students.
Growth was concentrated in older grades
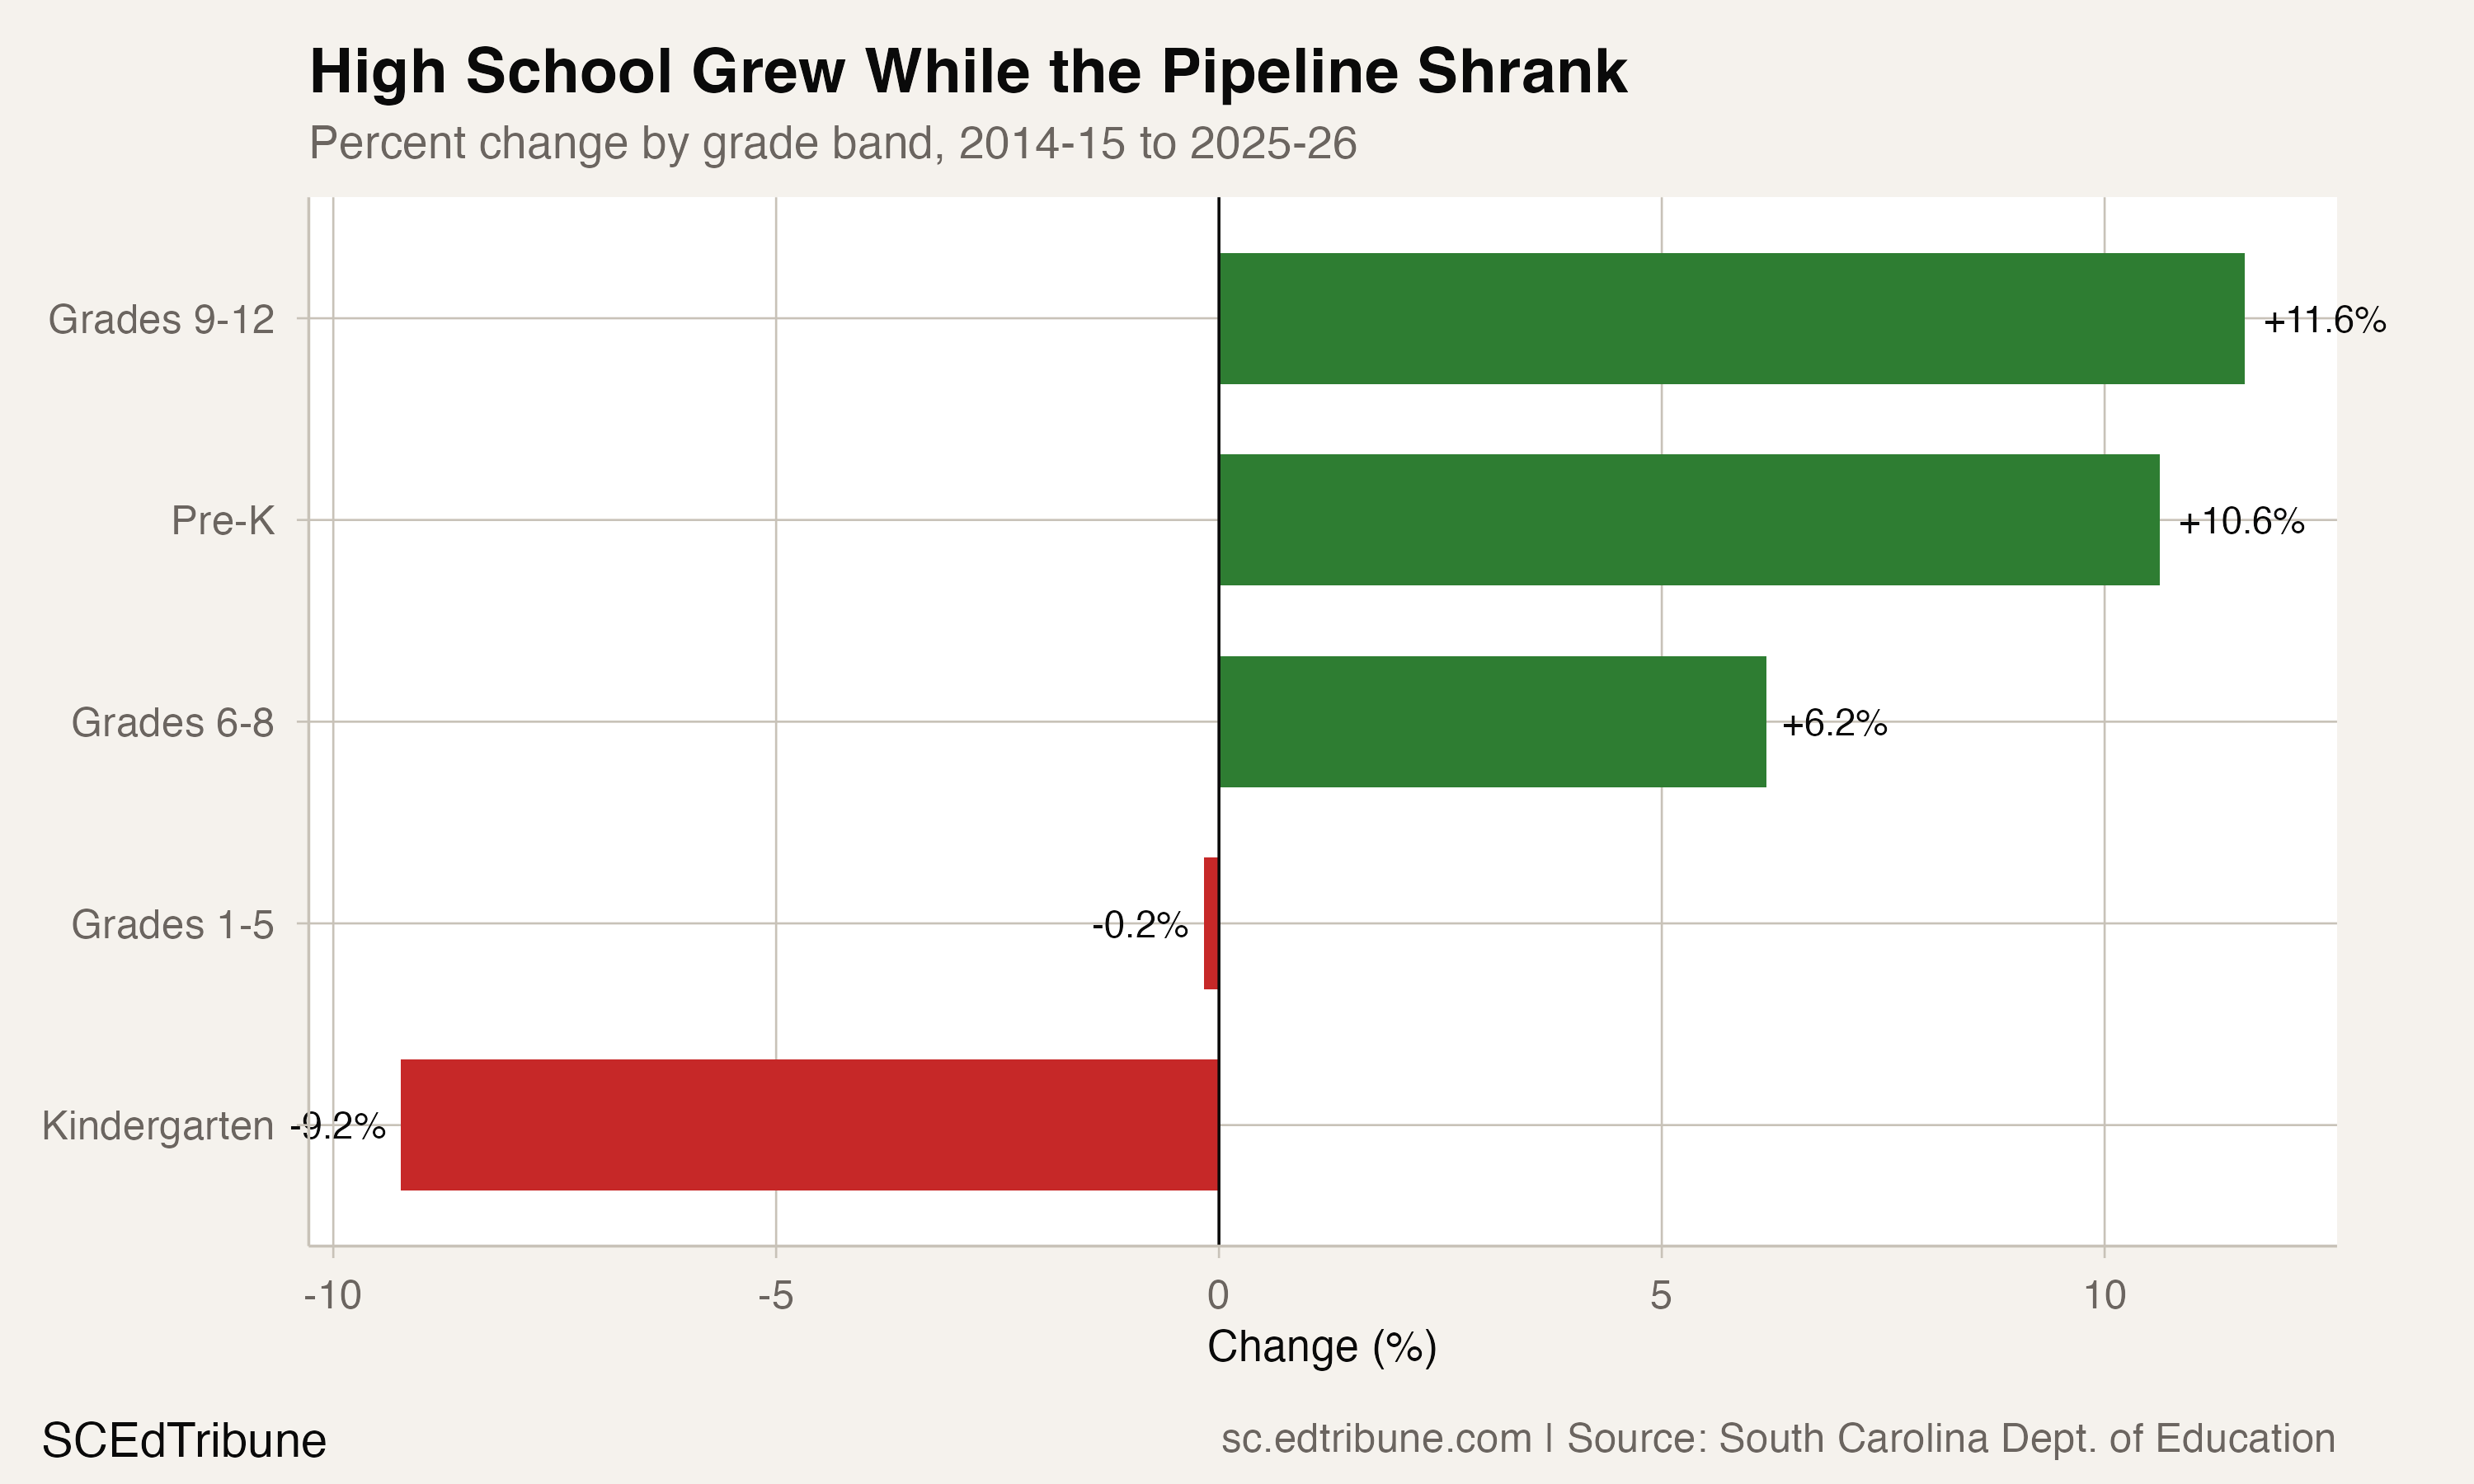
The grade-band endpoints show different directions across the system. Kindergarten fell by 5,390 students, or 9.2%. Grades 1-5 fell by 501 students, or 0.2%. Grades 6-8 added 10,412 students, or 6.2%, while grades 9-12 added 25,115 students, or 11.6%.
In 2025-26, ninth grade enrolled 67,375 students, 14,406 more than kindergarten. Ninth grade also exceeded the largest elementary grade by 8,598 students.
Transition ratios describe counts, not causes
Across 11 observed year-to-year comparisons, the next year's ninth-grade count averaged 113.8% of the prior year's eighth-grade count. The ratios ranged from 109.9% for the comparison beginning in 2019-20 to 115.6% for the comparison beginning in 2020-21.
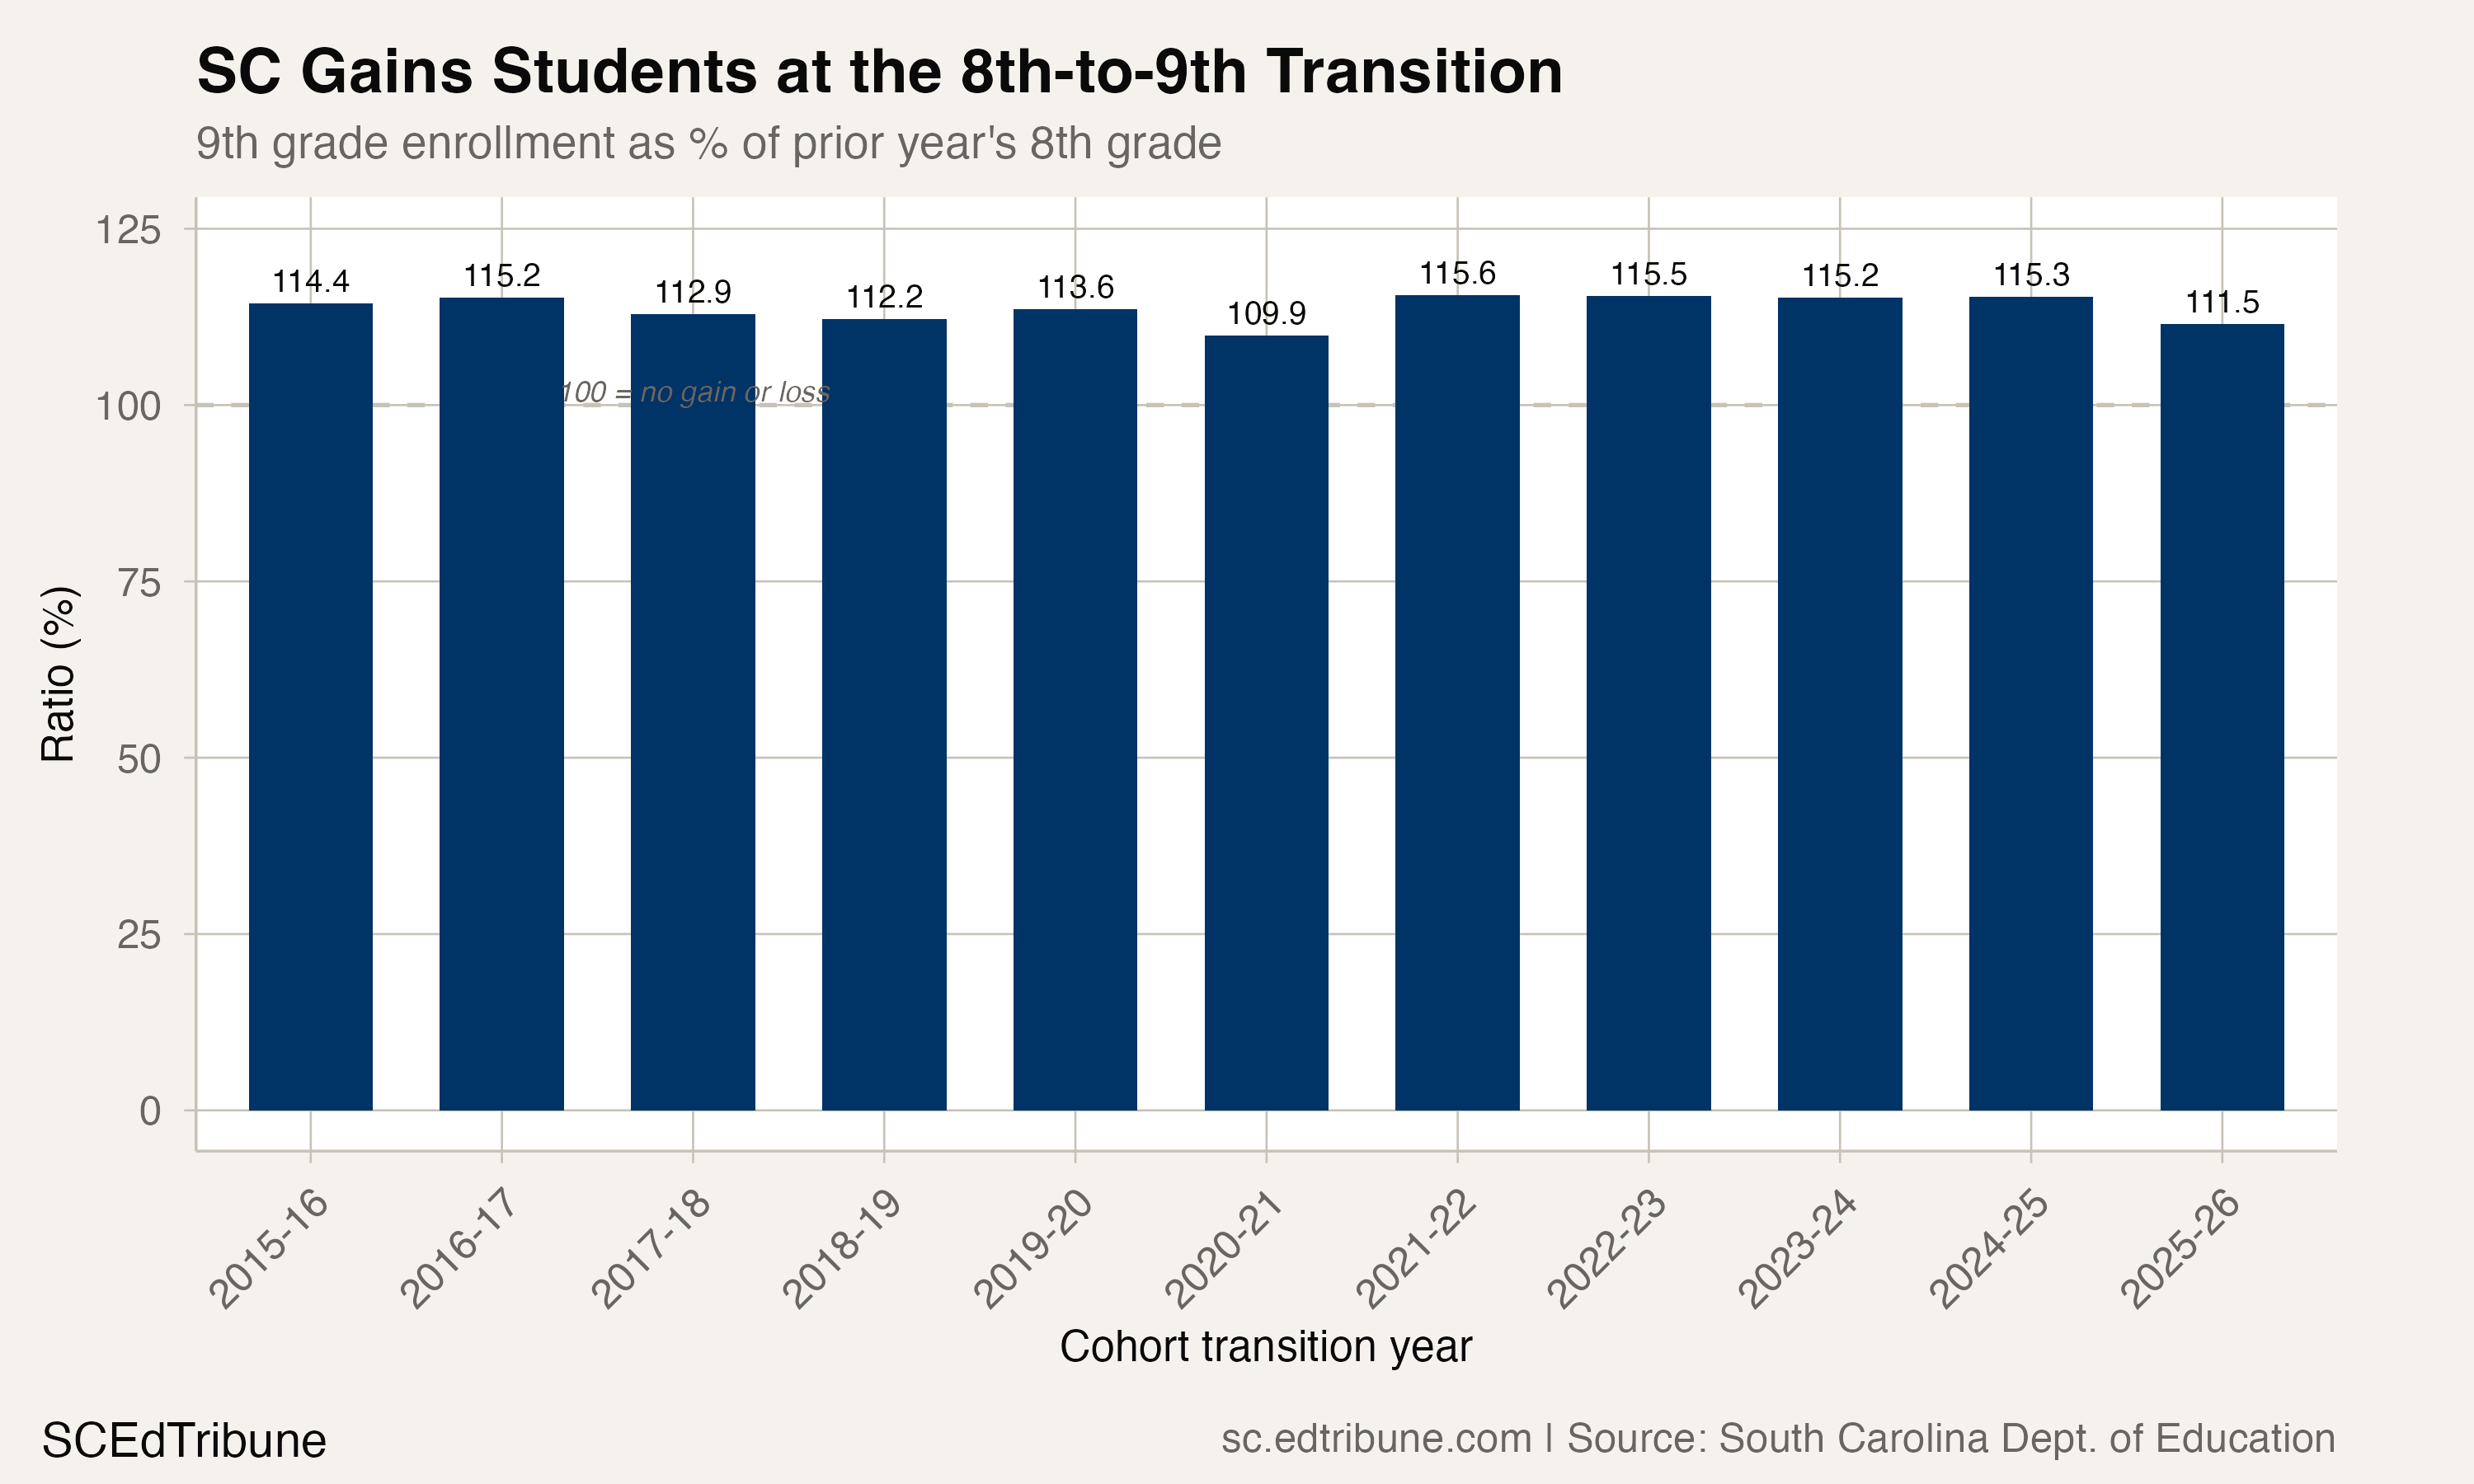
Those ratios do not identify why the counts differ. They cannot, by themselves, separate grade repetition, moves into or out of the state, or changes between public and nonpublic schooling.
The same limitation applies in the other direction. Across nine observed comparisons, the 12th-grade count three years later averaged 77.2% of the starting ninth-grade count. That is a comparison of aggregate grade counts, not a student-level survival or dropout rate.
Grades 9-12 reached 245,604 students in 2024-25, the highest point in the series, then fell by 3,671 to 241,933 in 2025-26. The package output establishes that one-year decline; it does not establish what later years will do.
Detailed code that reproduces the analysis and figures in this article is available exclusively to EdTribune subscribers.
Discussion
Sign in to join the discussion.
Loading comments...