Correction (May 14, 2026): An earlier version stated Berkeley 01 had the highest multiracial share among districts with at least 1,000 students, followed by Dorchester 02 and Horry 01. Two smaller districts, Union 01 and Marlboro 01, rank higher than Berkeley 01, and Anderson 05 ranks ahead of Horry 01. The comparison has been corrected to districts with at least 10,000 students and the full share ladder updated.
In 2017, South Carolina began reporting a racial category that had never appeared in its enrollment data: multiracial. That year, 29,119 students were counted. Nine years later, 50,431 are. The 73.2% increase makes multiracial students the fastest-growing racial group in the state's public schools, outpacing even the substantial gains among Hispanic students over the same period.
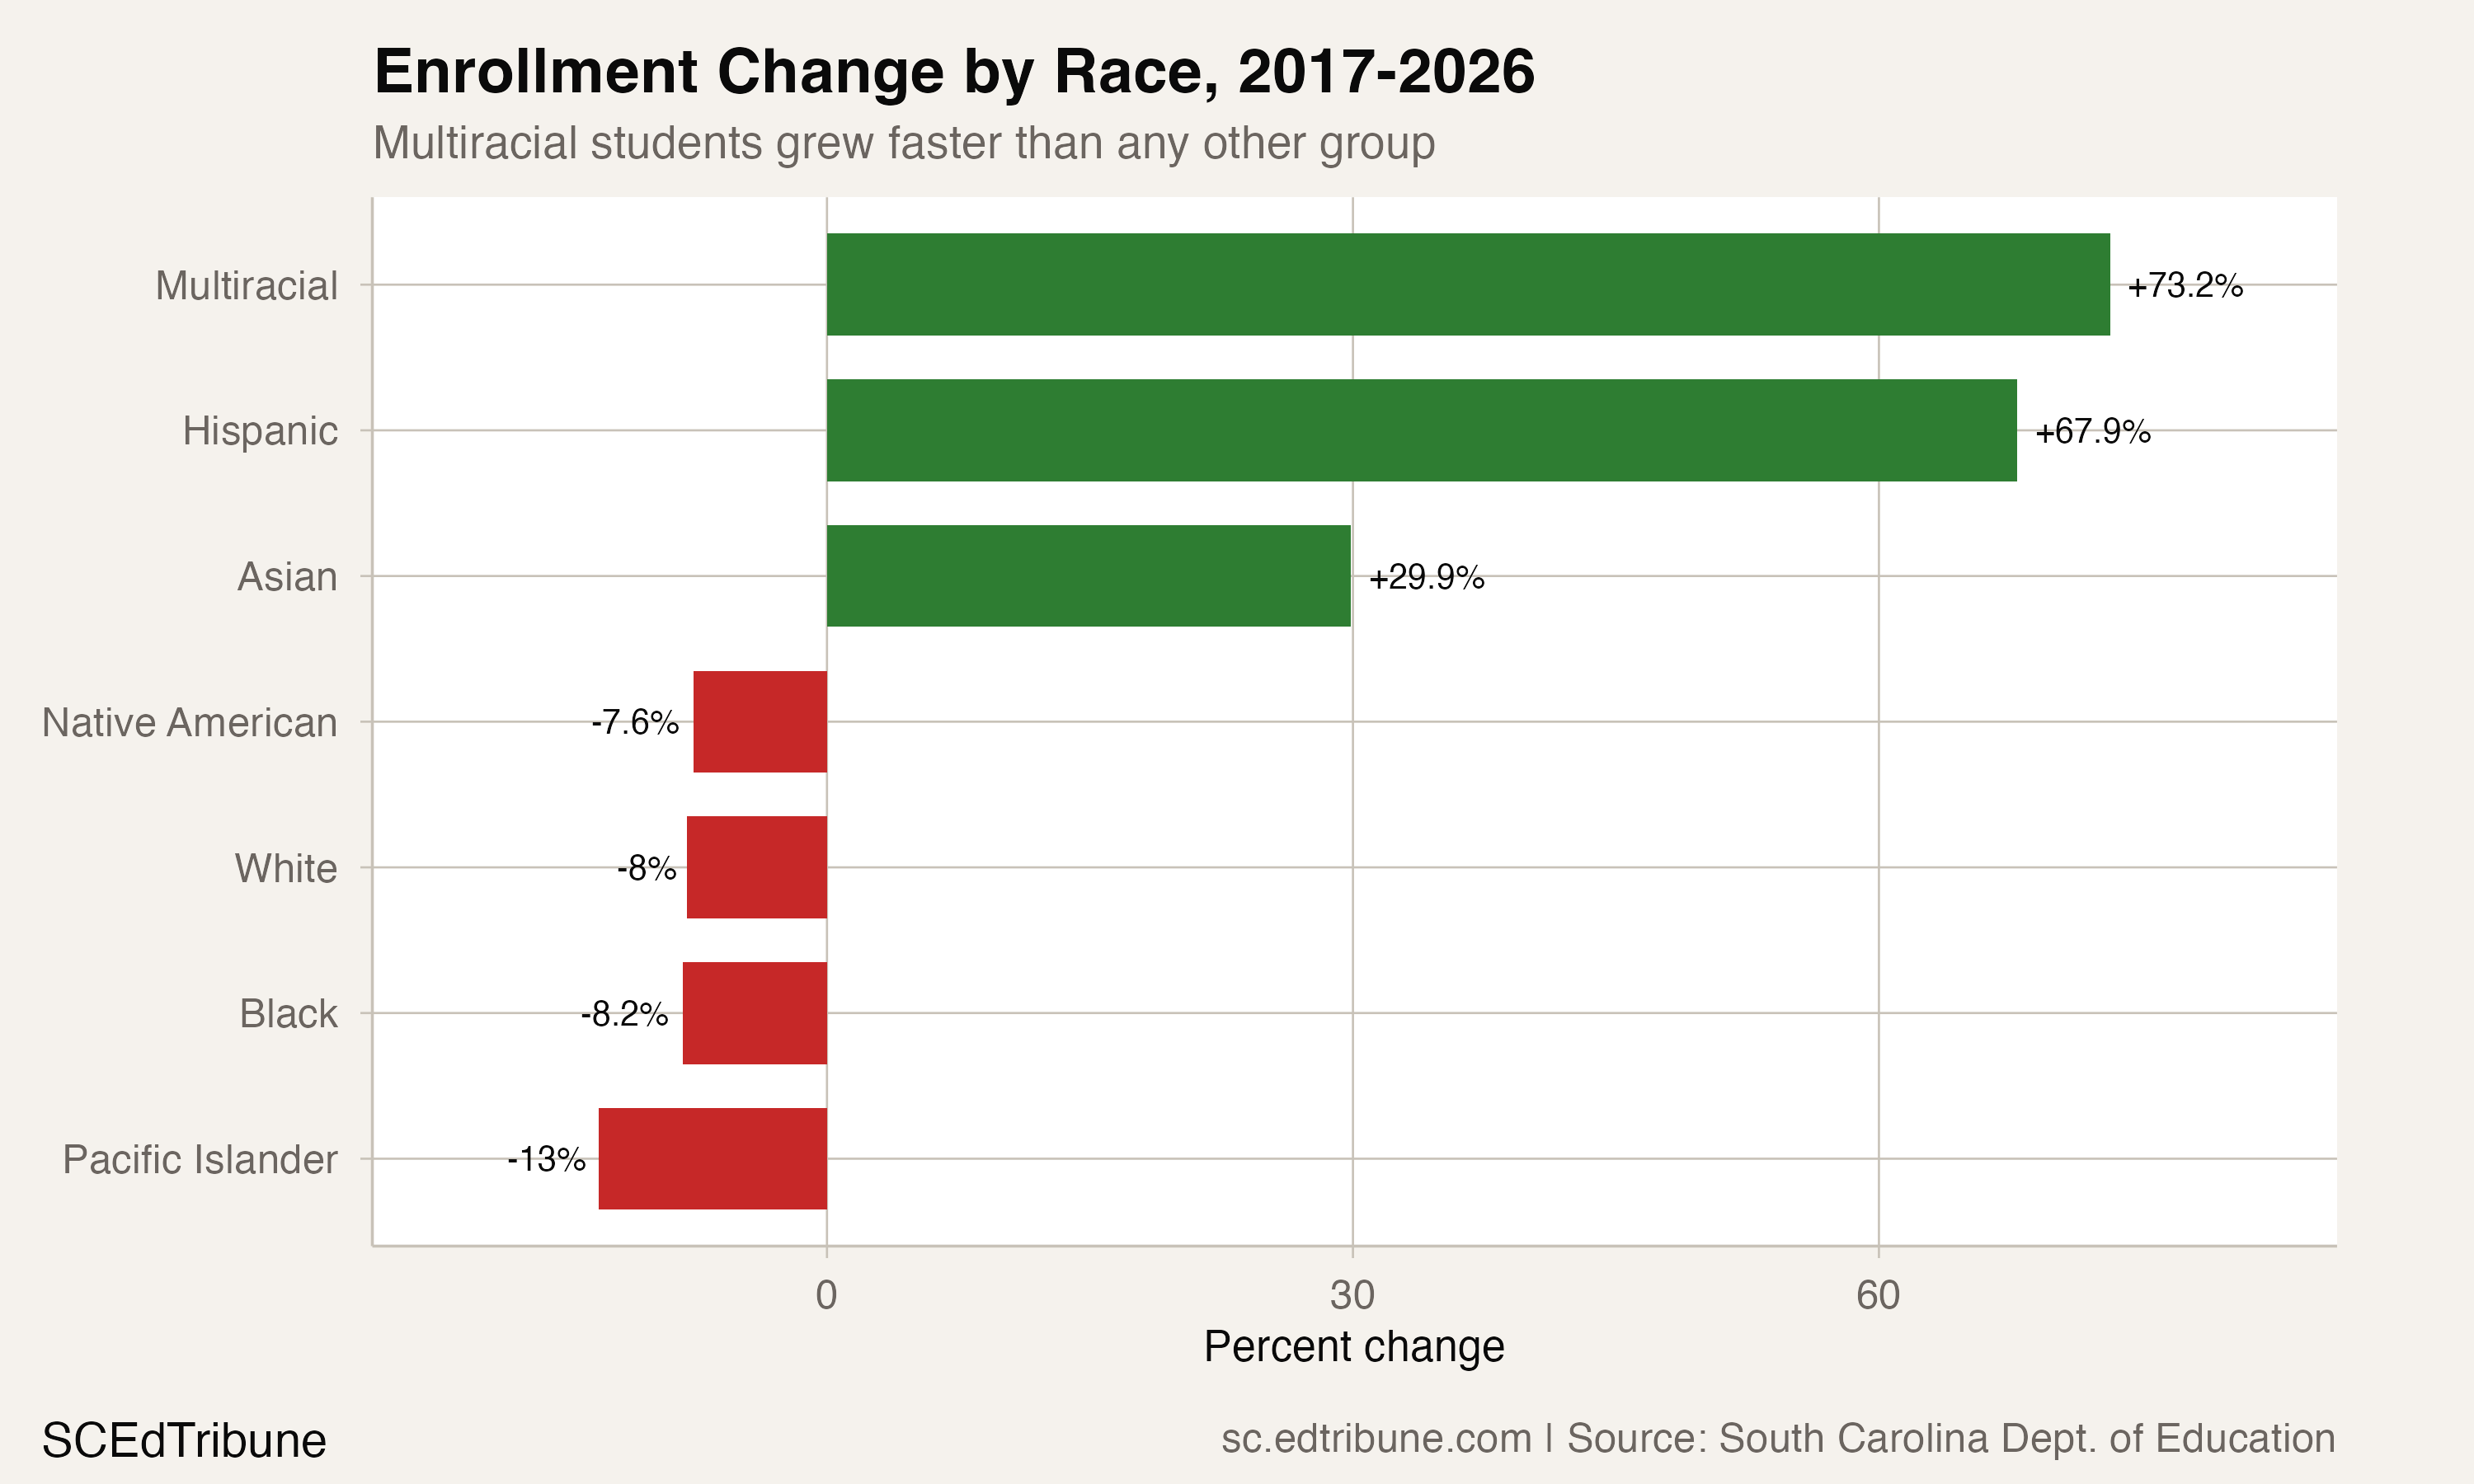
The question is what this number actually measures. Some portion of it reflects genuine demographic change: more children of parents from different racial backgrounds entering school. But another portion almost certainly reflects reclassification, where families that previously checked a single-race box now check two or more. The simultaneous drop in both Black (-8.2%) and Native American (-7.6%) enrollment since 2017, combined with a multiracial gain of 21,312 students, suggests both forces are at work.
The fourth-largest group, from a standing start
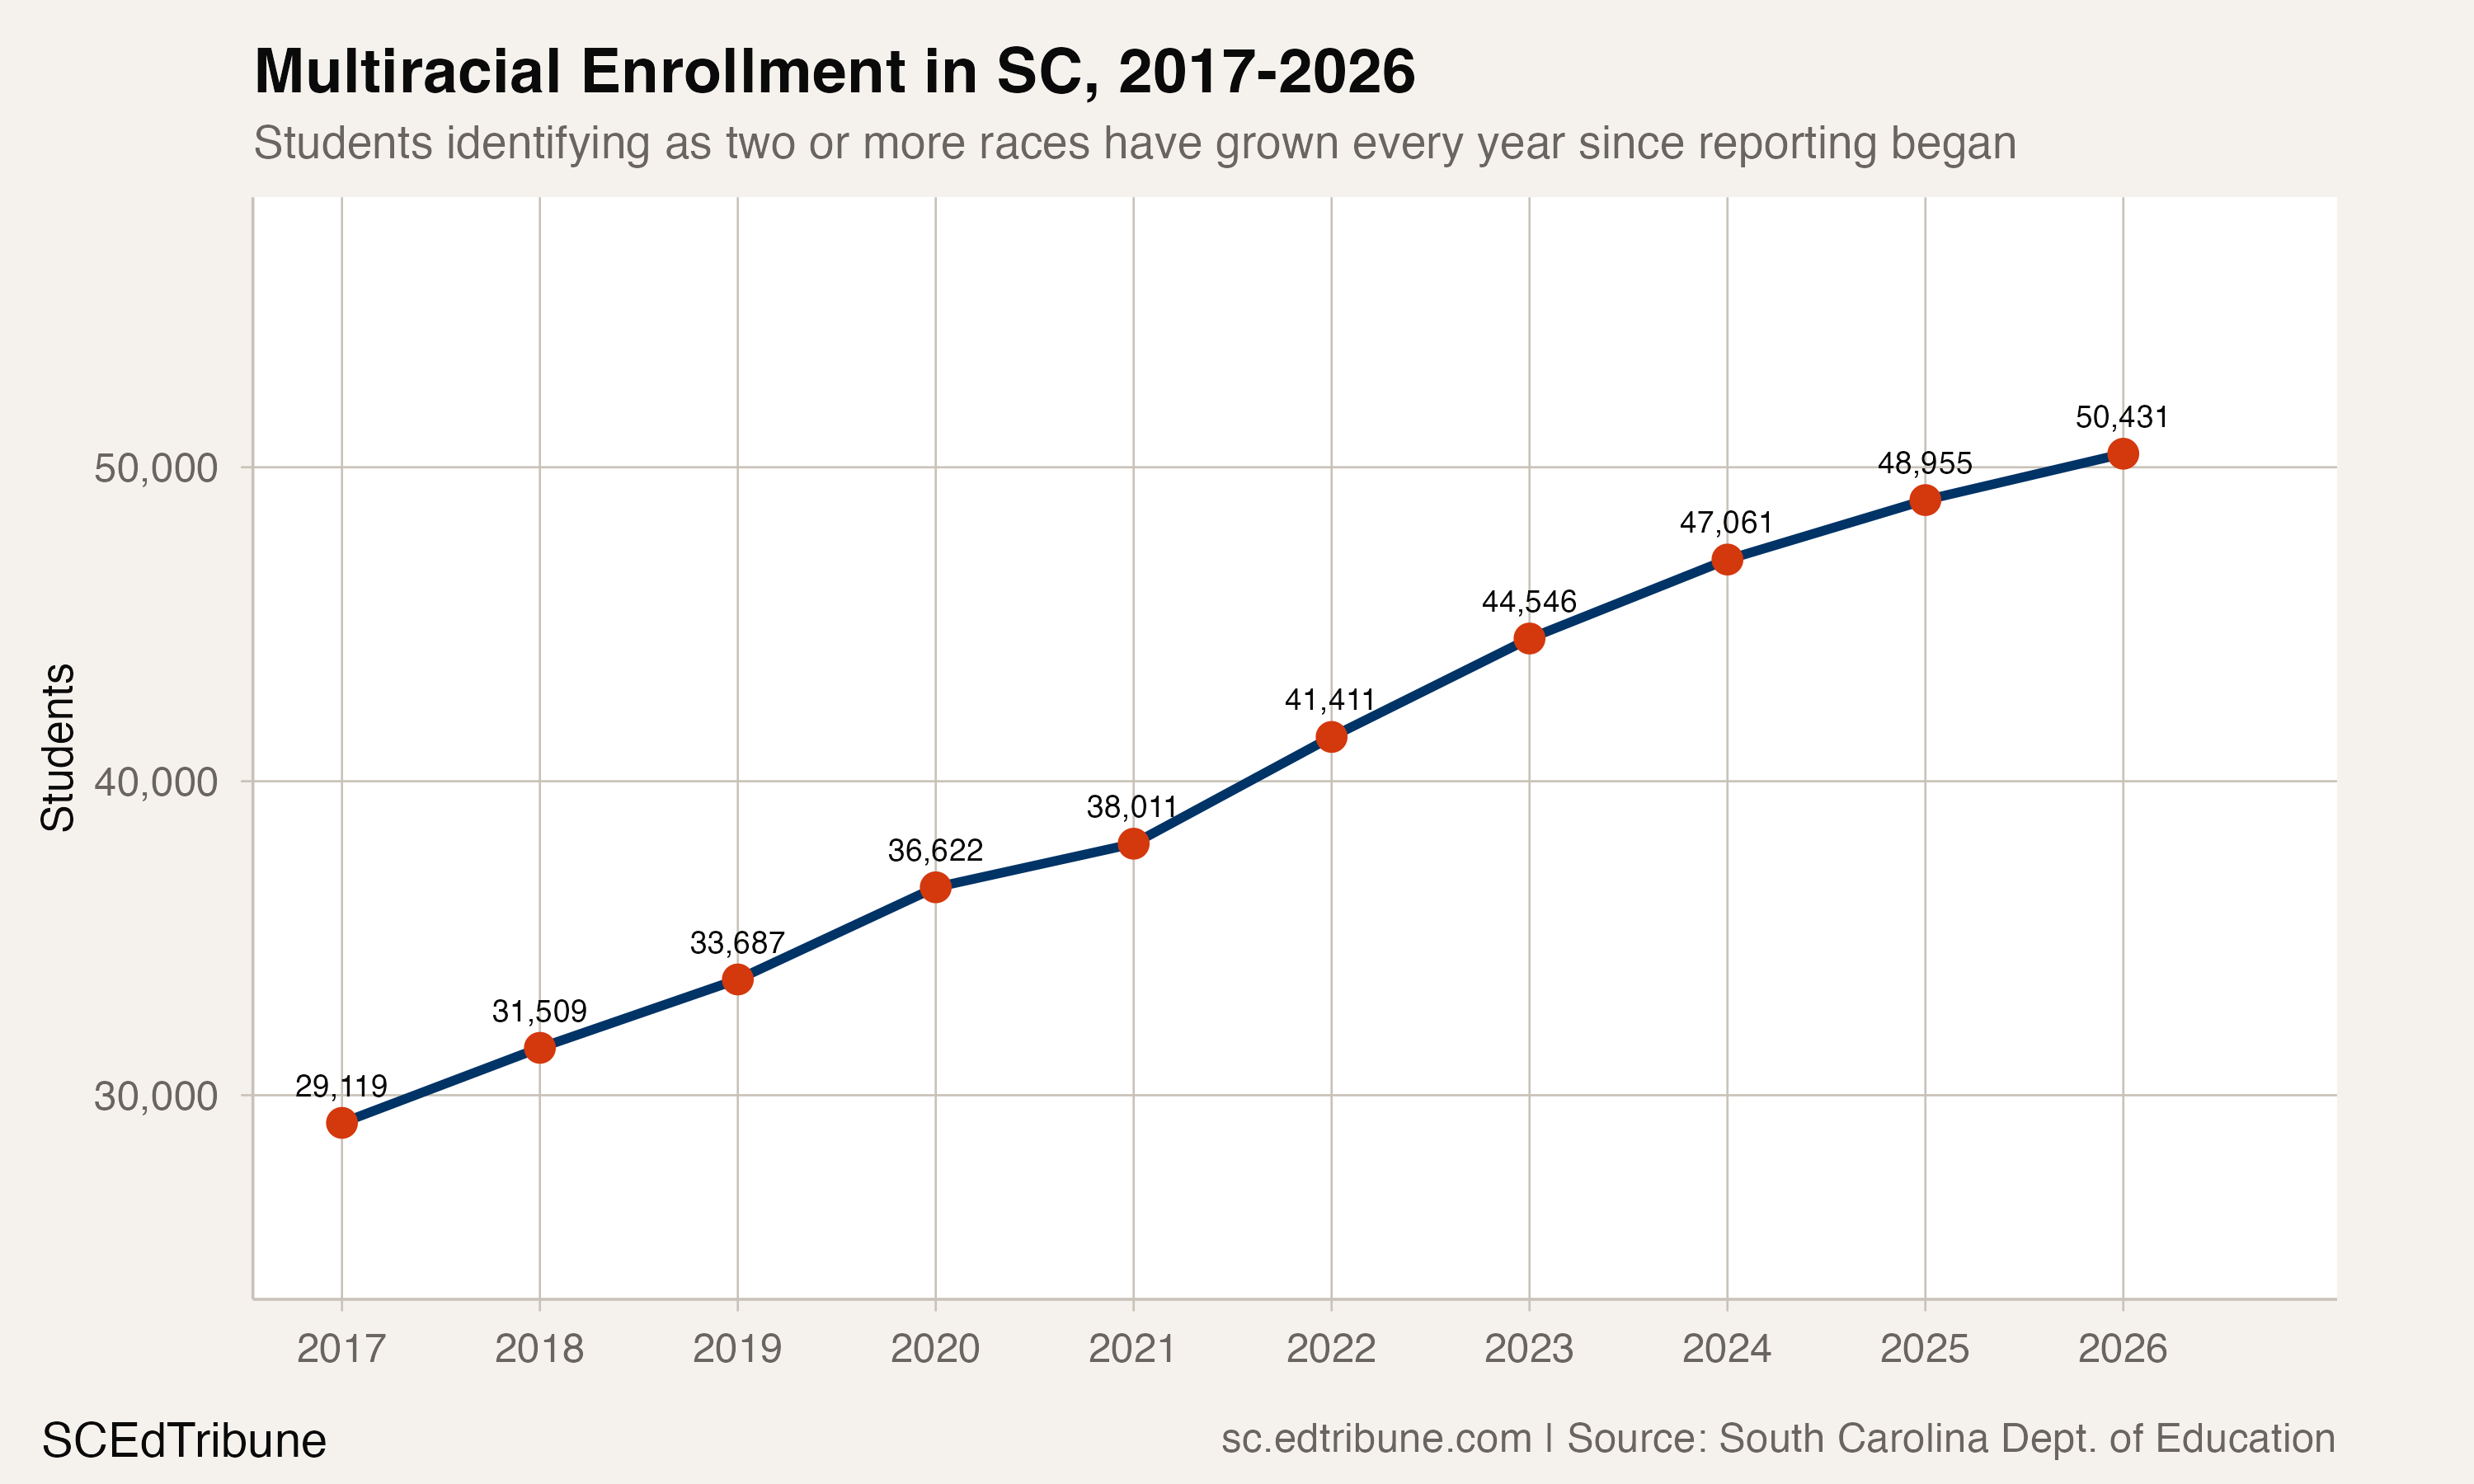
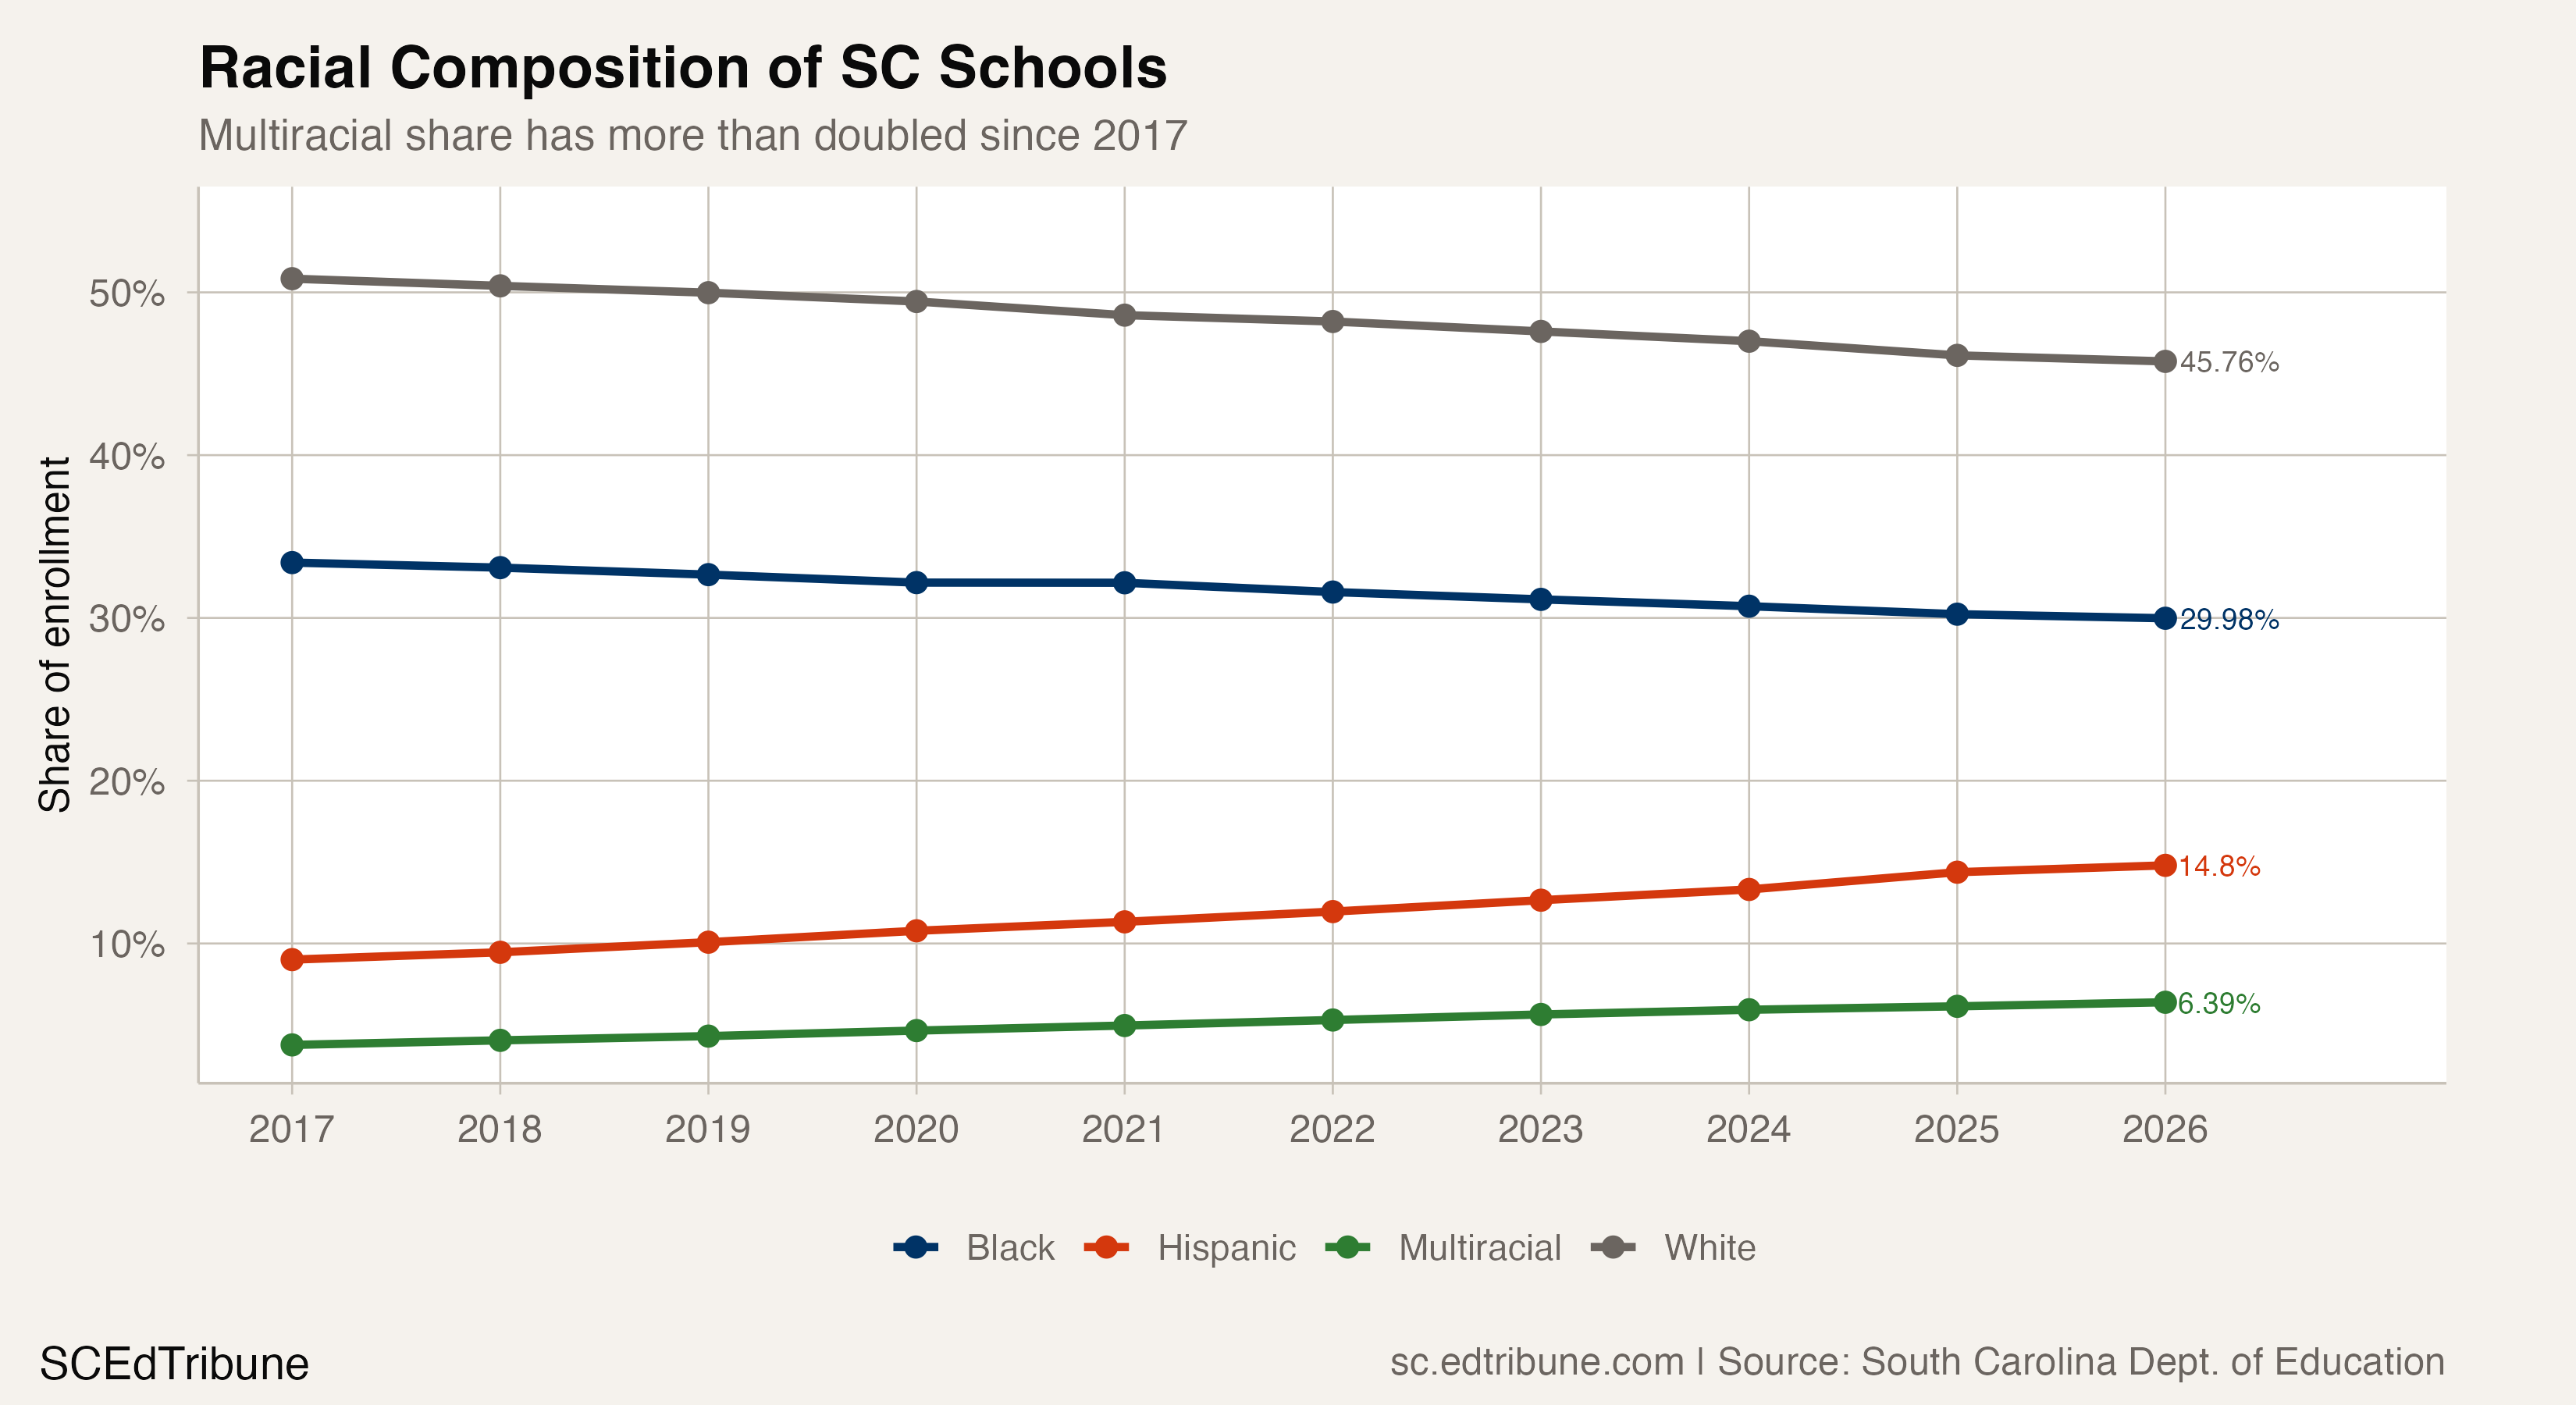
Multiracial enrollment has grown every single year since South Carolina began tracking it. The category added an average of 2,368 students per year from 2017 to 2026, climbing from 3.8% of total enrollment to 6.4%. It now ranks fourth among the state's seven racial groups, ahead of Asian (15,412) and Native American (2,244), and just behind Hispanic (116,754).
To put the growth in context: total statewide enrollment increased by 17,330 students between 2017 and 2026. Multiracial enrollment alone grew by 21,312. The multiracial category added more students than the state gained overall, because losses in other groups partially offset the total.
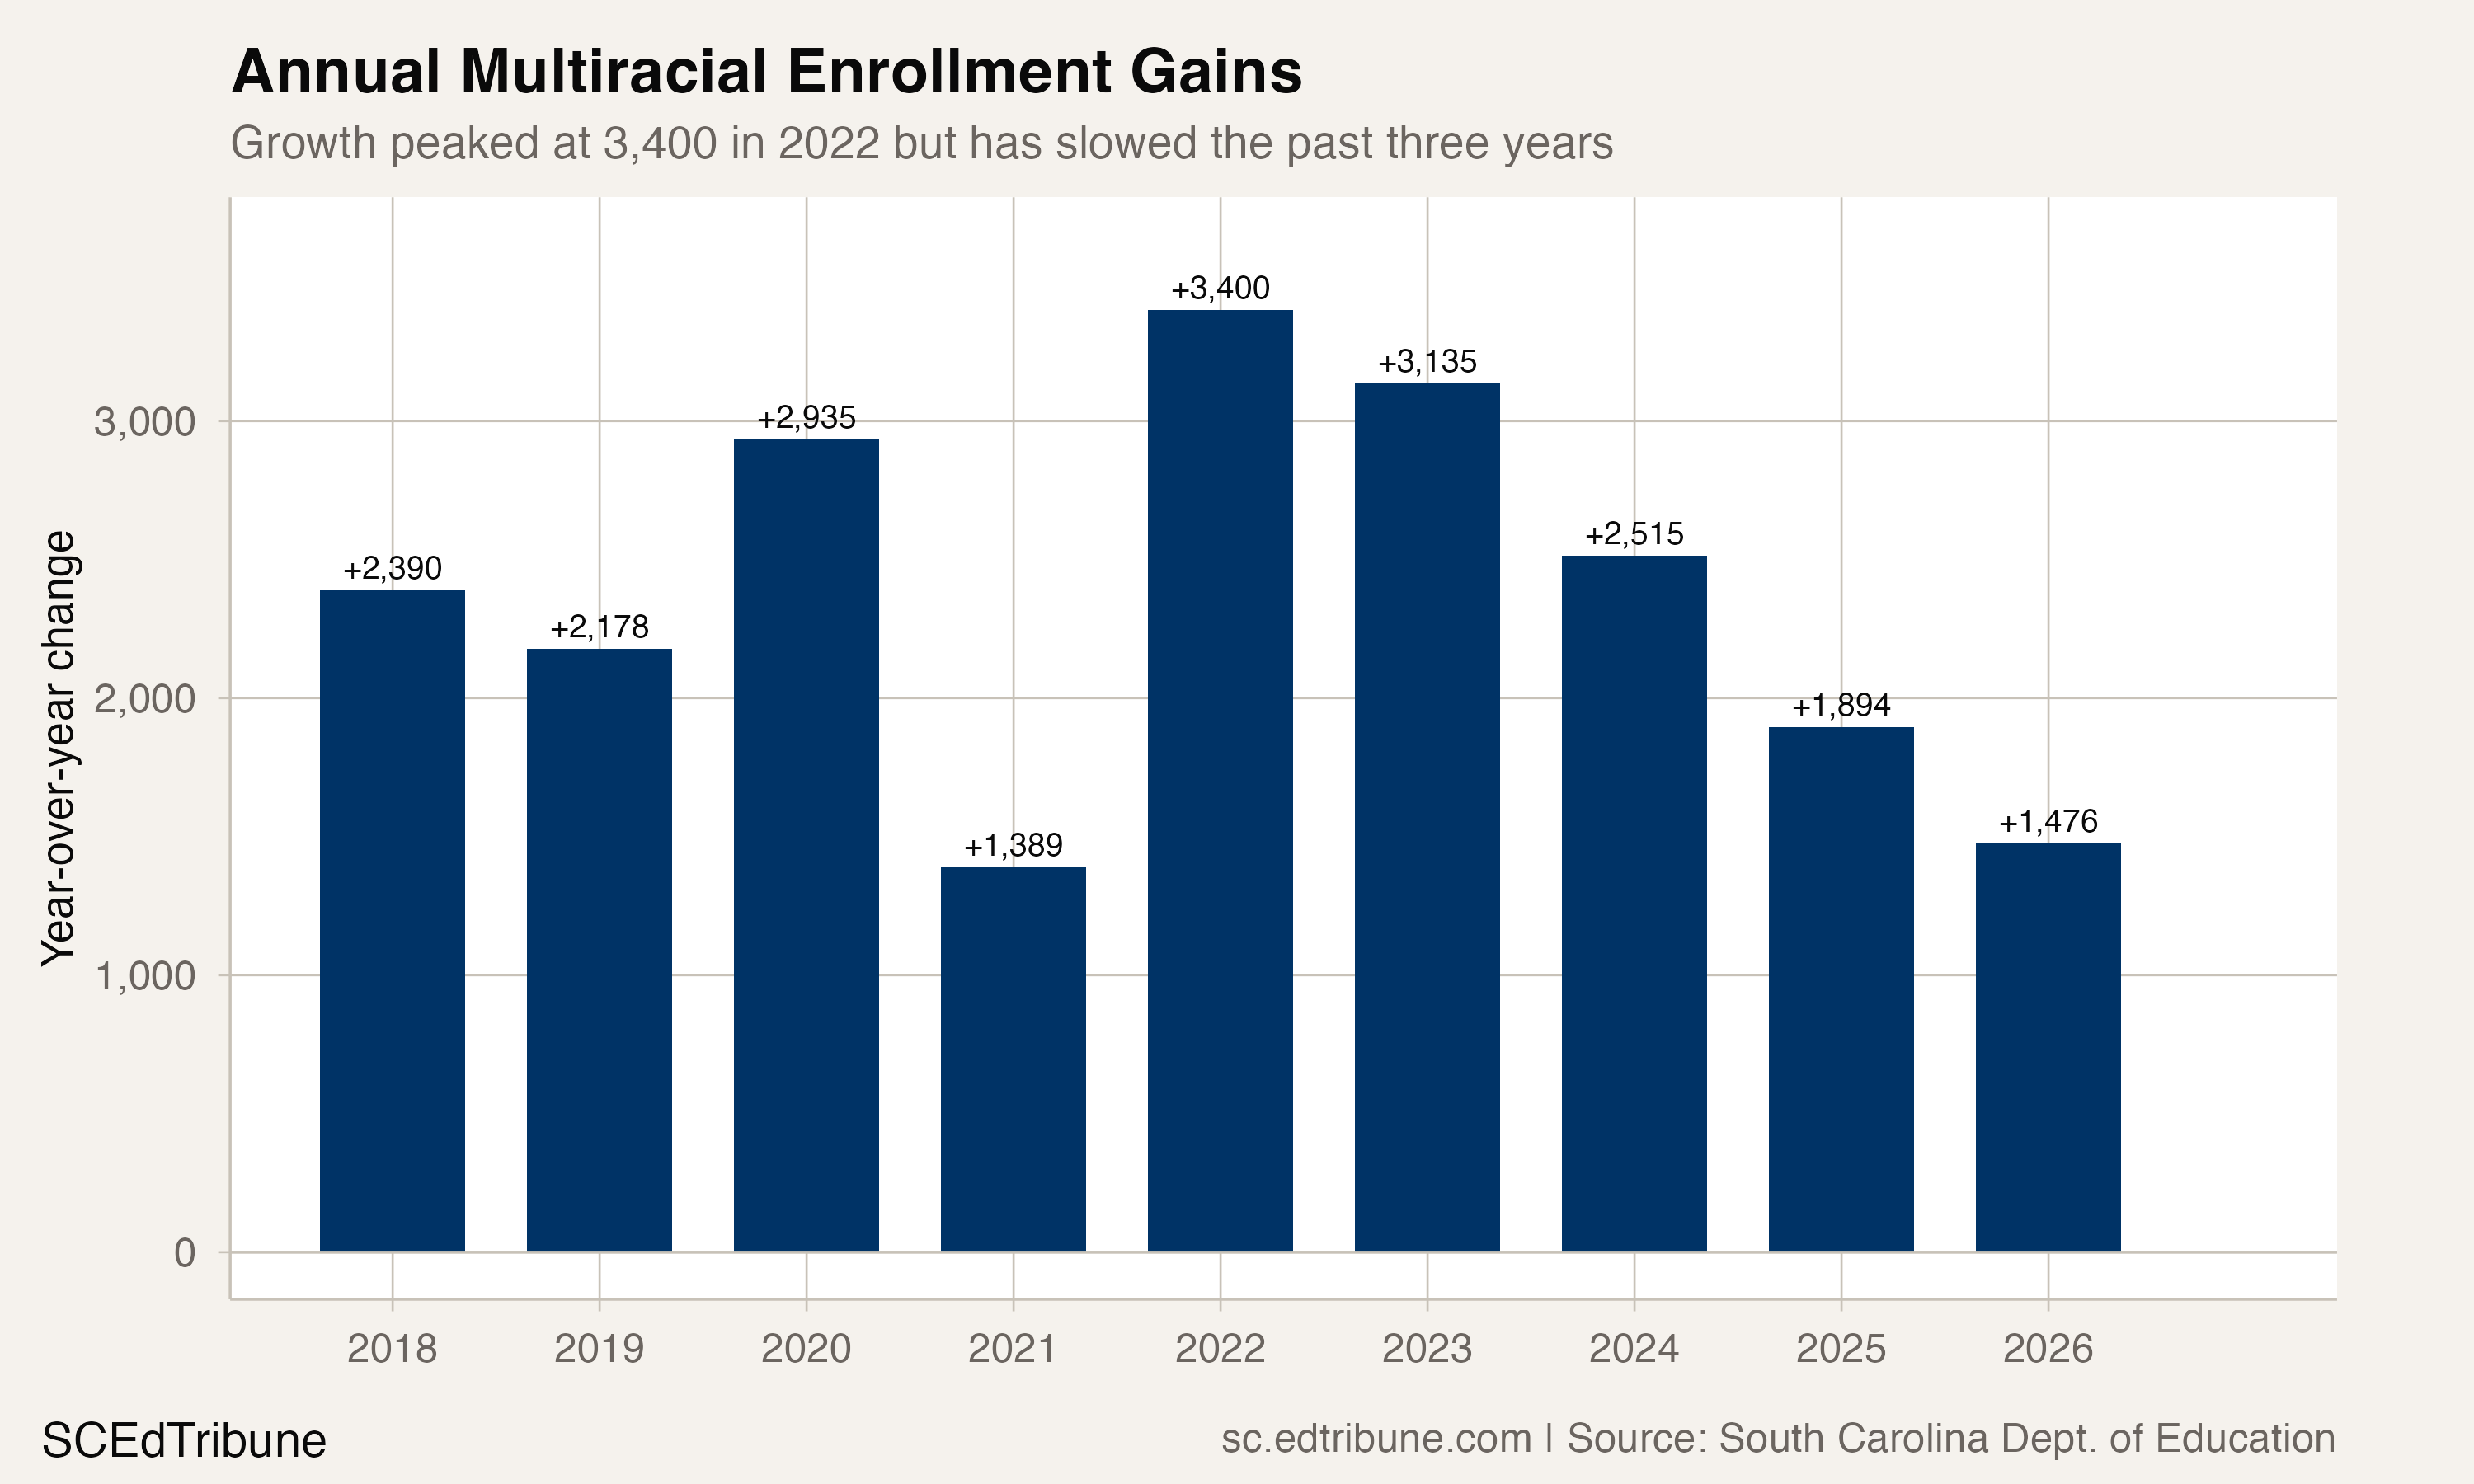
The growth has not been constant. It peaked in 2021-22, when 3,400 students were added in a single year. Since then, annual gains have tapered: 3,135 in 2023, 2,515 in 2024, 1,894 in 2025, and 1,476 in 2026. The category is still growing, but the rate of acceleration has slowed.
Who gained, who lost
The multiracial surge sits within a broader reshuffling of South Carolina's racial composition. Since 2017, white enrollment has fallen by 31,348 students (-8.0%), from 50.8% of total enrollment to 45.8%. Black enrollment has dropped by 21,221 (-8.2%), from 33.4% to 30.0%, falling below 30% for the first time in the data window.
Hispanic enrollment, meanwhile, has grown by 47,234 students (+67.9%), rising from 9.0% to 14.8% of total enrollment. The only groups posting faster percentage growth than Hispanic students are multiracial (+73.2%) and Asian (+29.9%).
The combined decline in Black and Native American enrollment since 2017 totals 21,406 students. The multiracial gain over the same period: 21,312. The near-exact match is suggestive but not definitive. Not every student who left the Black or Native American category entered the multiracial one. Some of the Black decline reflects genuine enrollment loss to private schools, home schooling, and out-of-state migration. Some of the multiracial gain reflects children entering kindergarten who were always going to be counted as multiracial. But the arithmetic is close enough to warrant caution about treating the full 73% surge as 50,000 new arrivals.
Arrival or reclassification?
The enrollment data cannot distinguish between a child who was always multiracial and one whose family changed how they reported their race. Both show up the same way in the numbers. Nationally, multiracial students grew from 1.4 million to 2.5 million between 2012 and 2022, a 79% increase that mirrors South Carolina's trajectory. That national pattern reflects at least two distinct forces.
The first is demographic. Roughly 17% of U.S. newlyweds in 2015 married someone of a different race or ethnicity, more than five times the rate in 1967. The children of those marriages are now school-age. In the 2020 Census, 5.8% of South Carolina's total population identified as two or more races, up substantially from prior counts. The school enrollment share of 6.4% running slightly higher than the total population share is consistent with multiracial identity being more common among younger cohorts.
The second force is reporting behavior. The federal government's 2024 revision to Statistical Policy Directive 15 will combine race and ethnicity into a single question and explicitly encourage respondents to select multiple categories. Full compliance is not required until March 2029, but the shift signals a broader cultural movement toward multiracial identification that has been building for years. Nationally, the percentage of individuals classified as both Native American and another race grew 160% between the 2010 and 2020 censuses. South Carolina's 7.6% decline in Native American enrollment since 2017 is consistent with this pattern.
The honest answer is that the 73% growth reflects both forces, and no enrollment dataset can tell you the ratio. What it can tell you is that the category is large enough to matter.
Where the growth is concentrated
The multiracial surge is not evenly distributed. Larger districts, with 20,000 or more students, have an average multiracial share of 6.8%, compared to 4.8% in districts with fewer than 5,000 students. The districts adding the most multiracial students in absolute terms are coastal and suburban: Horry 01↗ET (+1,486), Charleston 01↗ET (+1,075), Florence 01↗ET (+899), and Dorchester 02↗ET (+856).
Among districts with at least 10,000 students, Berkeley 01↗ET has the highest multiracial share at 9.7%, followed by Dorchester 02 at 9.3%, Anderson 05↗ET at 8.8%, and Horry 01 at 8.4%. The Lowcountry military corridor, anchored by Joint Base Charleston and the Marine Corps installations near Beaufort, likely contributes to the elevated rates in Berkeley, Dorchester, and Horry. Military communities tend to have higher rates of interracial families and more familiarity with multiracial identification on enrollment forms.
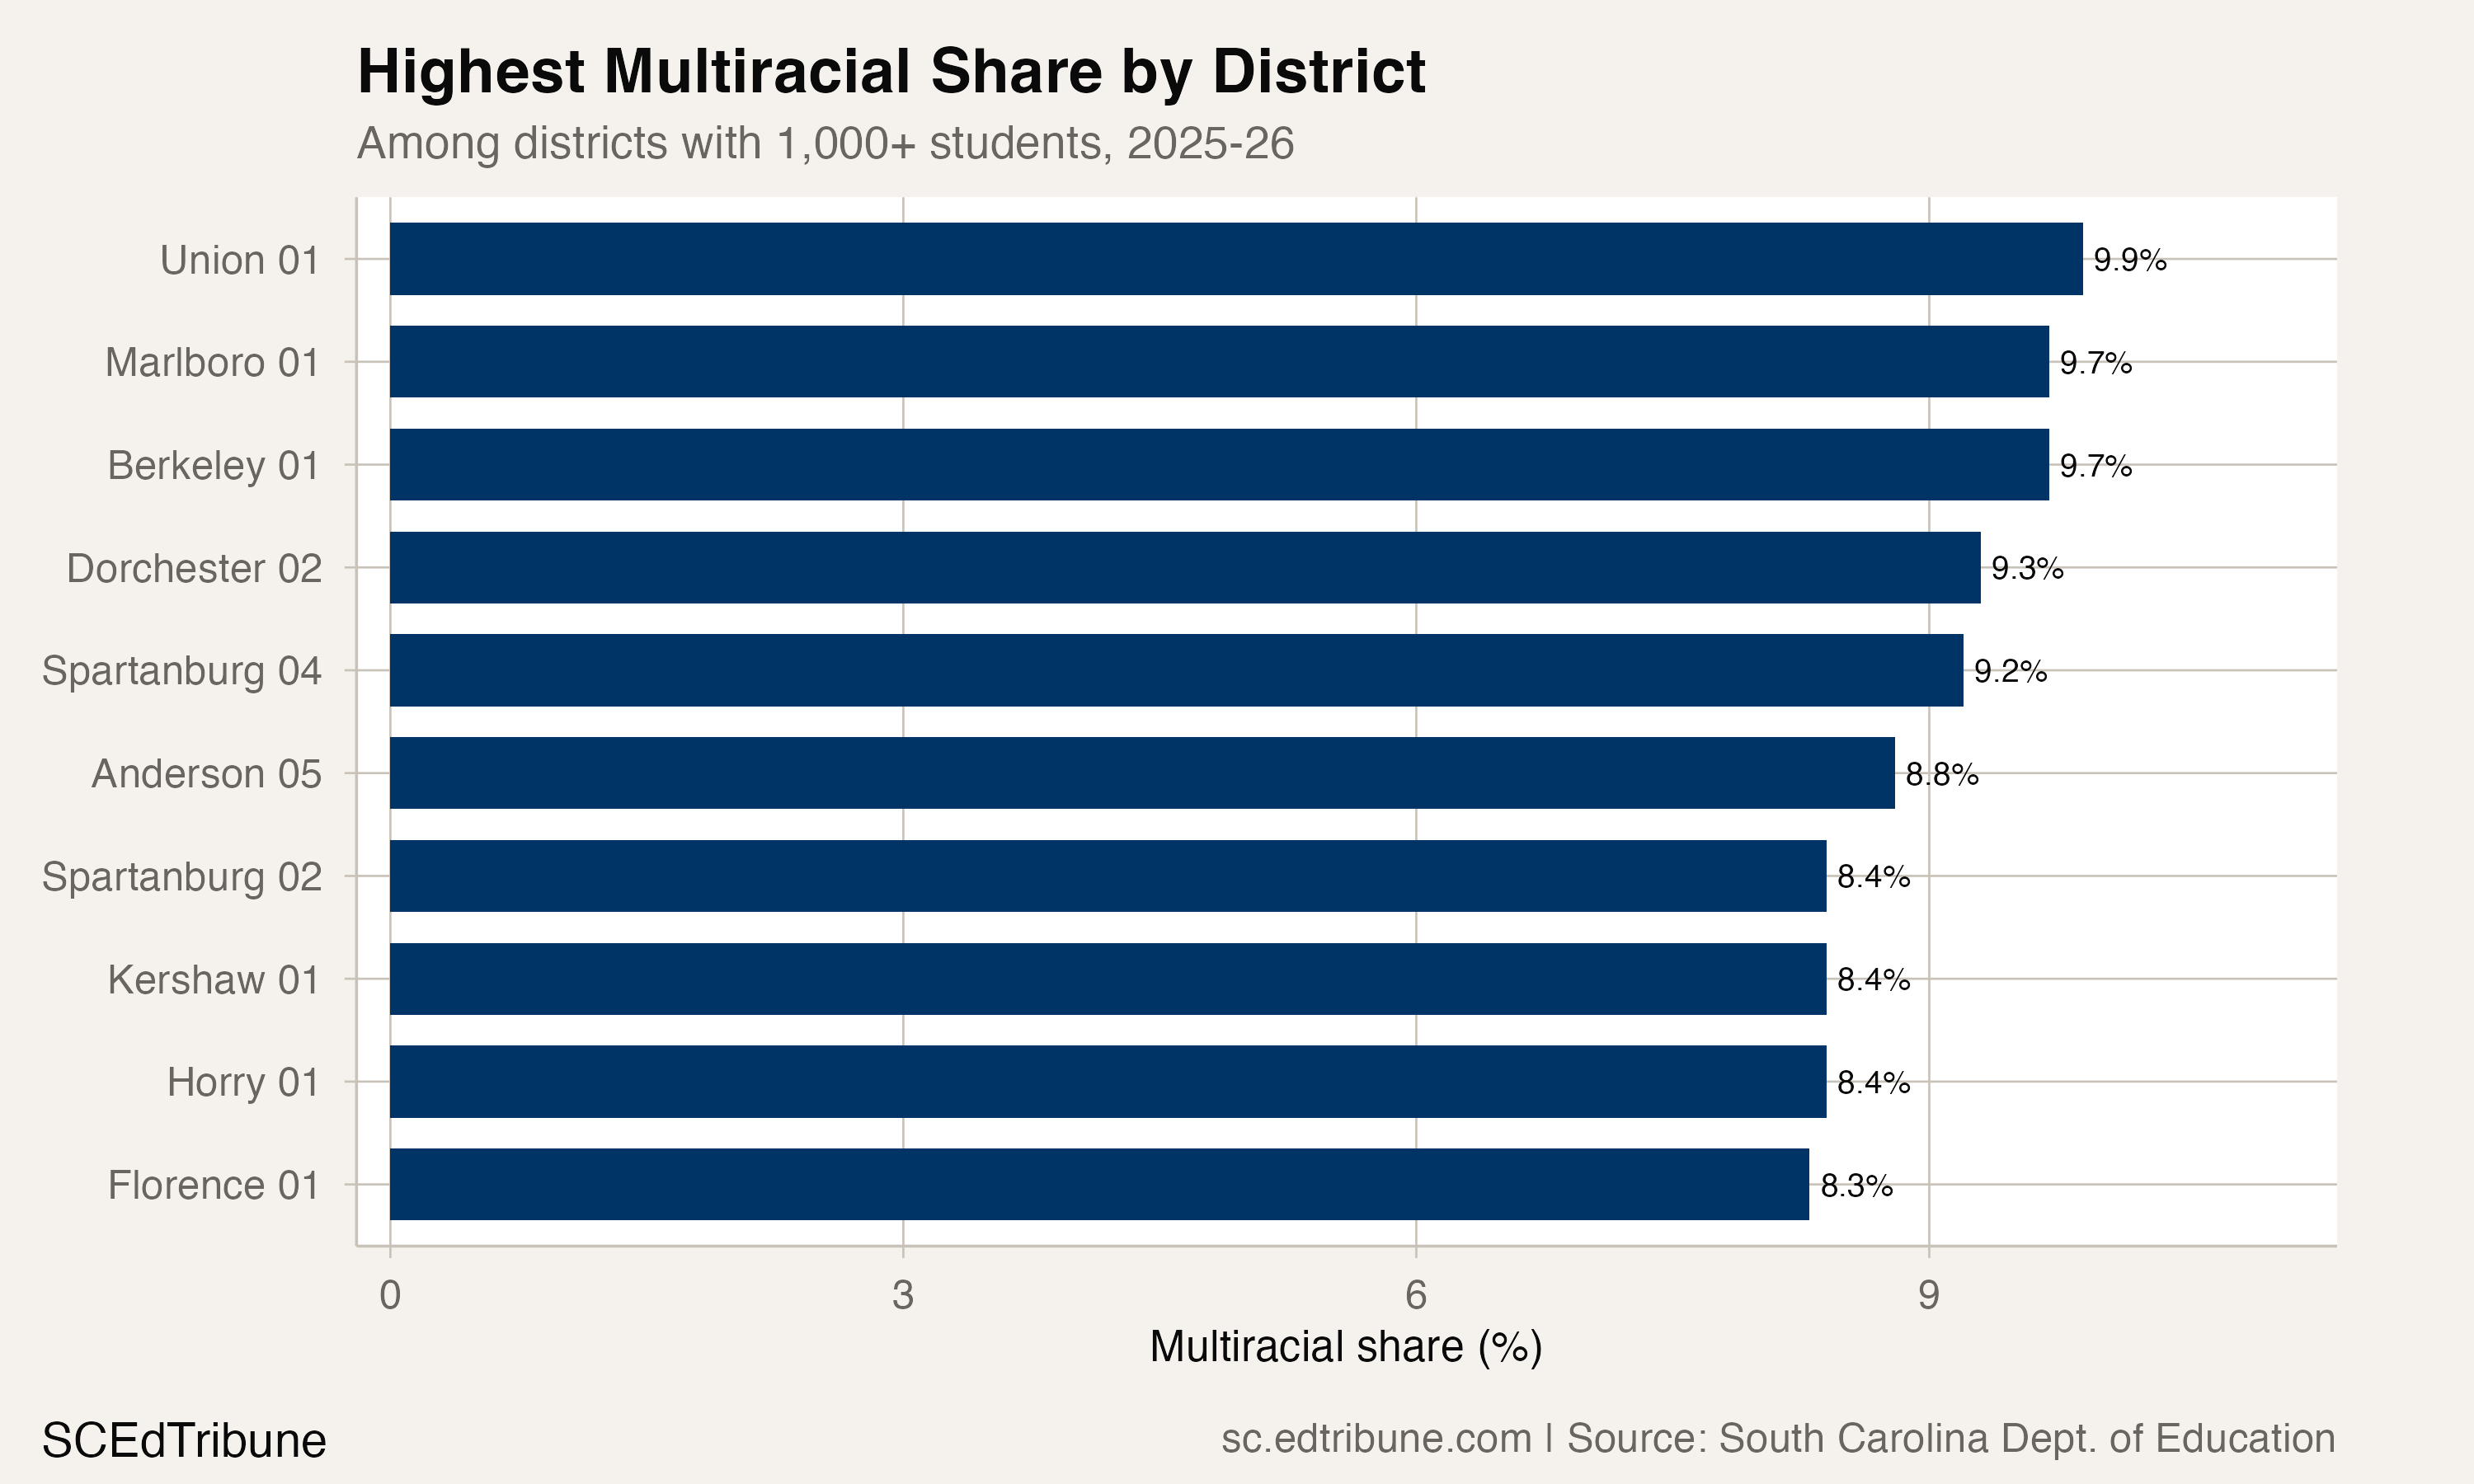
Florence 01 stands out with the fastest growth rate among large districts: a 224.2% increase, from 401 multiracial students in 2017 to 1,300 in 2026. Spartanburg 02↗ET posted a 210.4% gain, from 328 to 1,018. These rates suggest that reporting practices in certain districts may have shifted more than demographics did. A district tripling its multiracial count in nine years is far more consistent with reclassification than with migration patterns.
What this reshapes
At 6.4% and growing, multiracial students are large enough to affect how districts plan but small enough that they rarely drive policy conversations. Unlike Hispanic or Black students, multiracial students are dispersed: nationally, 99% of multiracial students attend schools where fewer than 25% of their peers share their racial category. They do not cluster in ways that create obvious programmatic needs, but their growth has structural consequences.
Every student who moves from a single-race category to multiracial changes the denominator in racial composition calculations. If a school's Black enrollment appears to decline by 5% over several years but half of that decline reflects reclassification rather than actual departures, then funding formulas, diversity targets, and desegregation compliance reports built on those numbers are measuring a reporting change, not a population change.
South Carolina's multiracial share will almost certainly continue climbing even as the rate of growth decelerates. The OMB's 2029 reporting deadline will push more families toward selecting multiple categories. The children of the intermarriage generation are just entering their school years. And the cultural shift toward multiracial identification, once it begins, does not reverse.
The 50,431 multiracial students enrolled today are the most visible sign of a state whose racial categories no longer capture the complexity of its families. The systems built around those categories have not adapted yet.
Detailed code that reproduces the analysis and figures in this article is available exclusively to EdTribune subscribers.
Discussion
Sign in to join the discussion.
Loading comments...