Correction: An earlier version misstated the 2022 gap, undercounted the number of larger district cohorts below 55%, incorrectly said the special-education rate improved more slowly than the all-student rate, and projected a timeline to parity that the data do not establish. It also used an incorrect “one in four” headline for the complement of a 61.6% rate. This version reports the executed state-package results without that forecast or unsupported explanations.
South Carolina reported a 61.6% four-year graduation rate for students with disabilities in 2025, compared with 86.7% for all students. The difference was 25.1 percentage points, and the published special-education cohort contained 8,381 students.
Among 15 statewide subgroup rows published by the package for 2025, special education had the second-lowest rate. The foster-care row was lower at 44.8%.
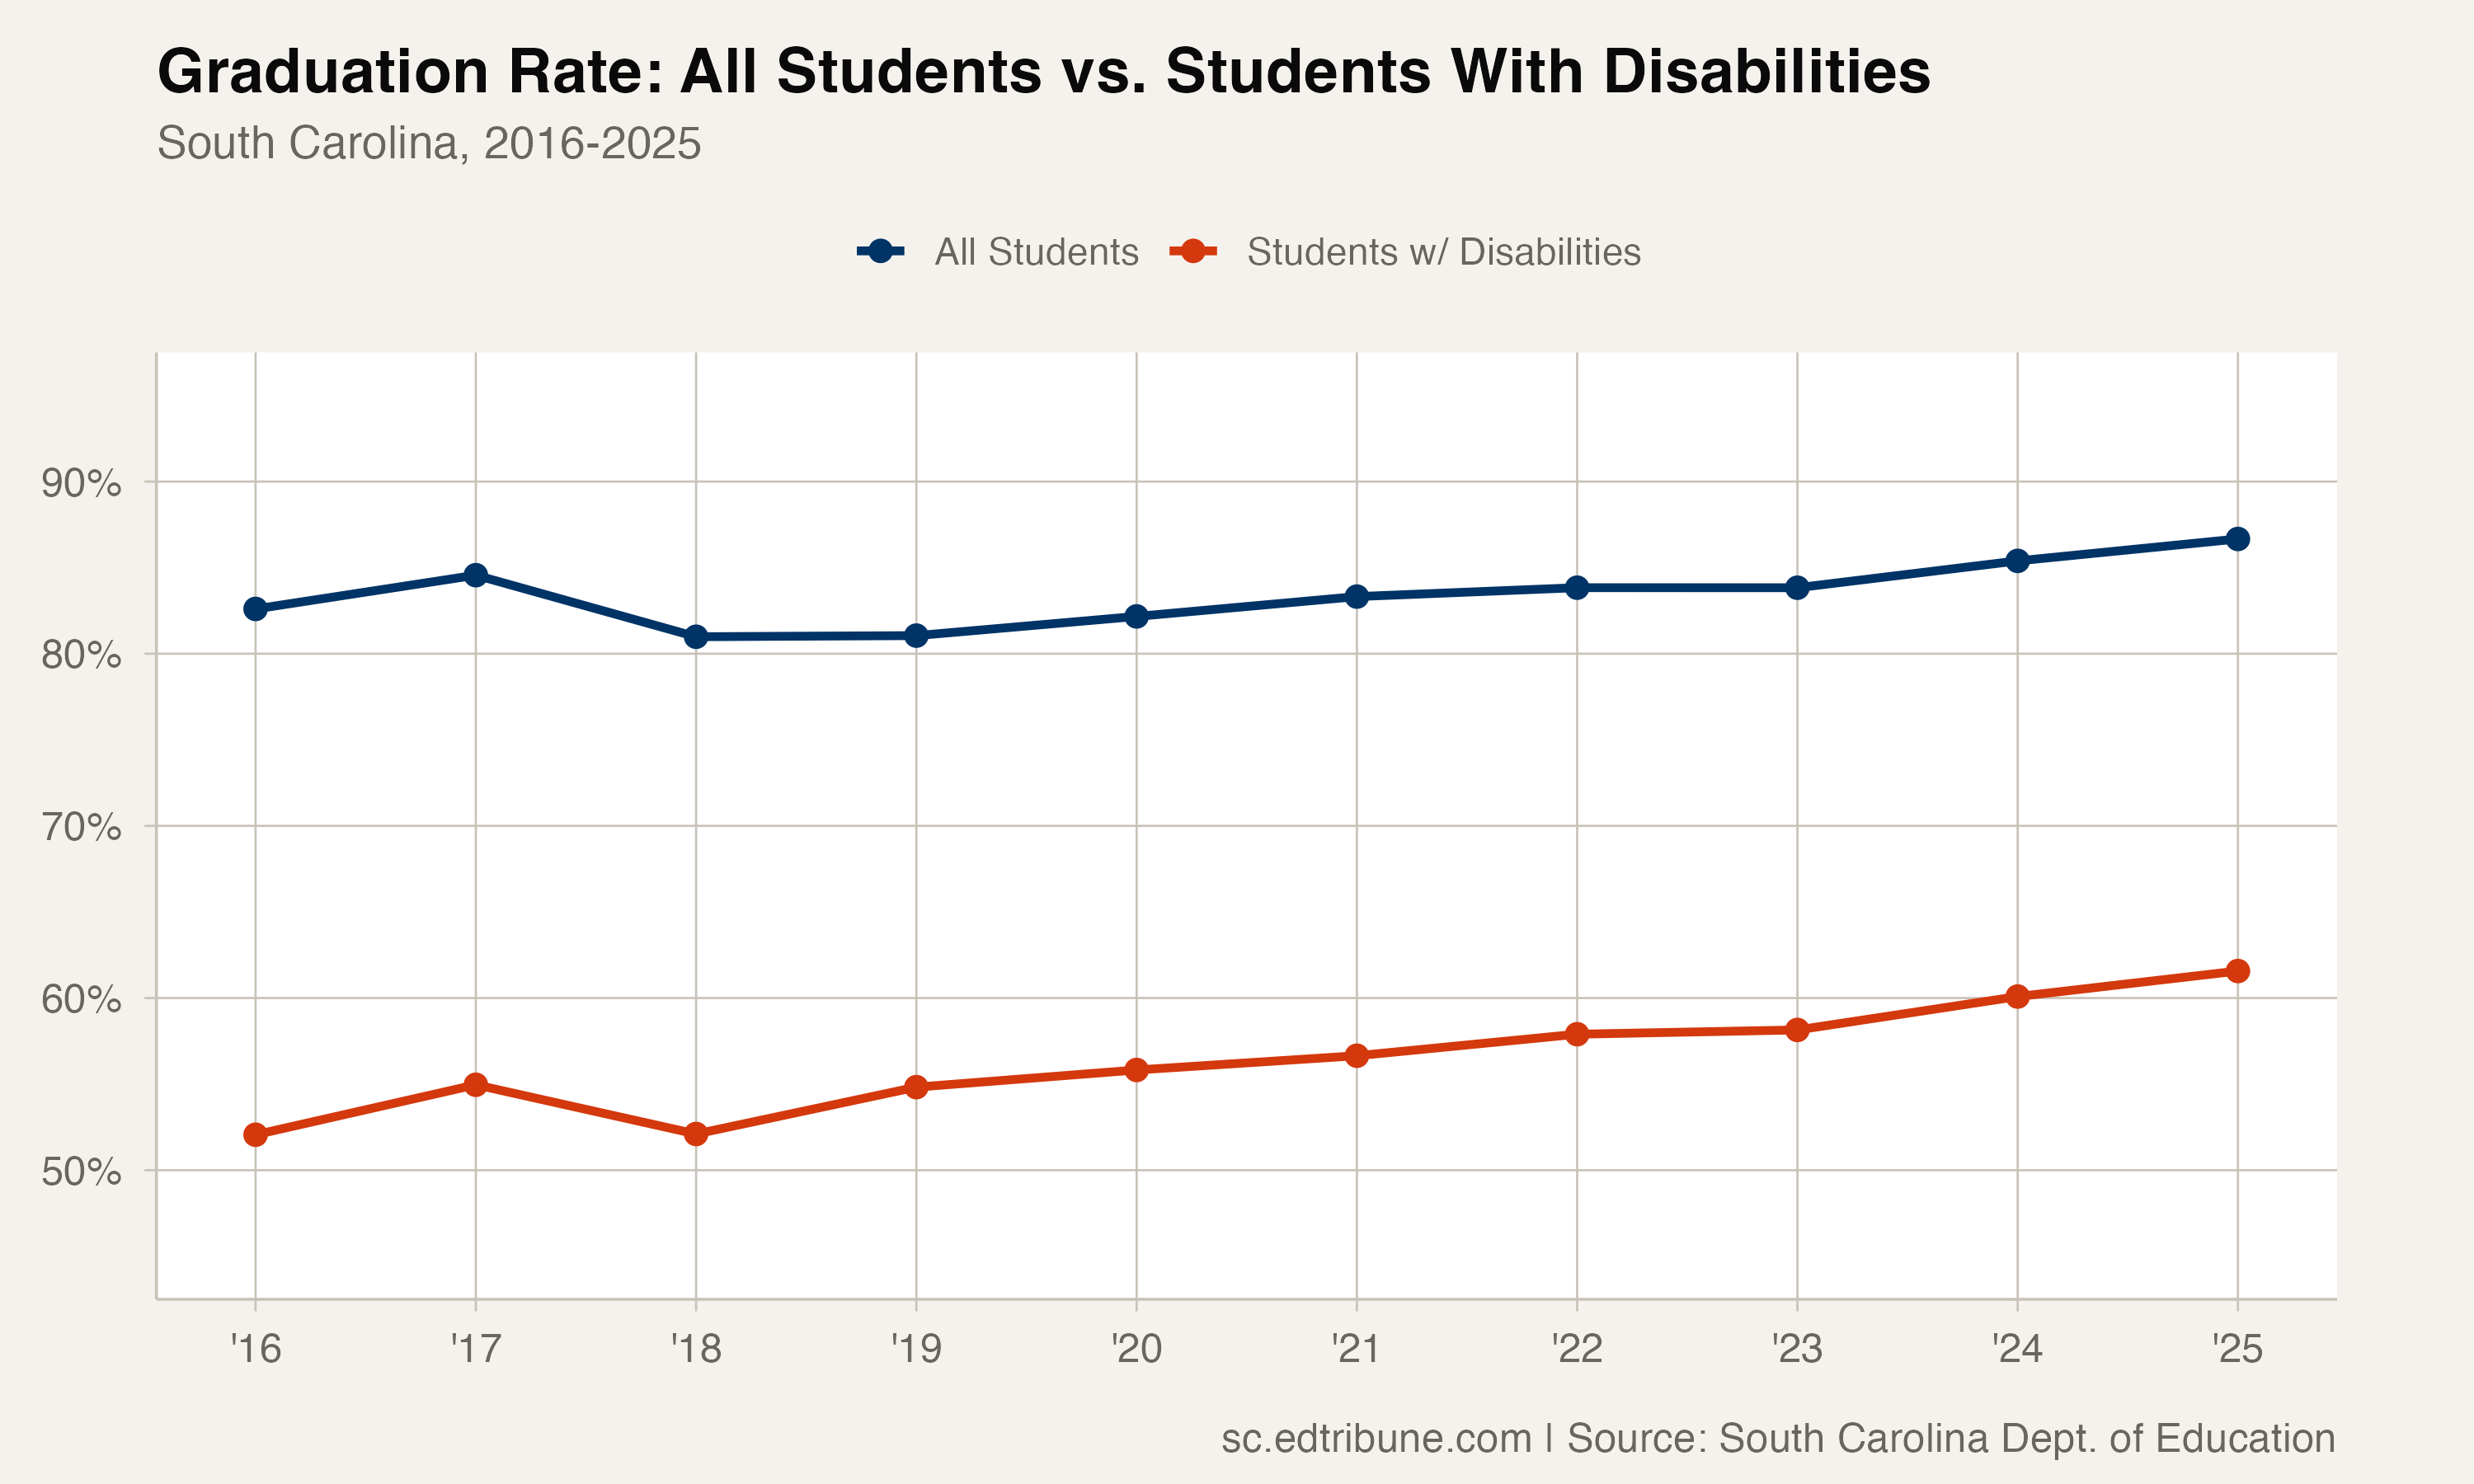
The rate rose faster, but the gap remained large
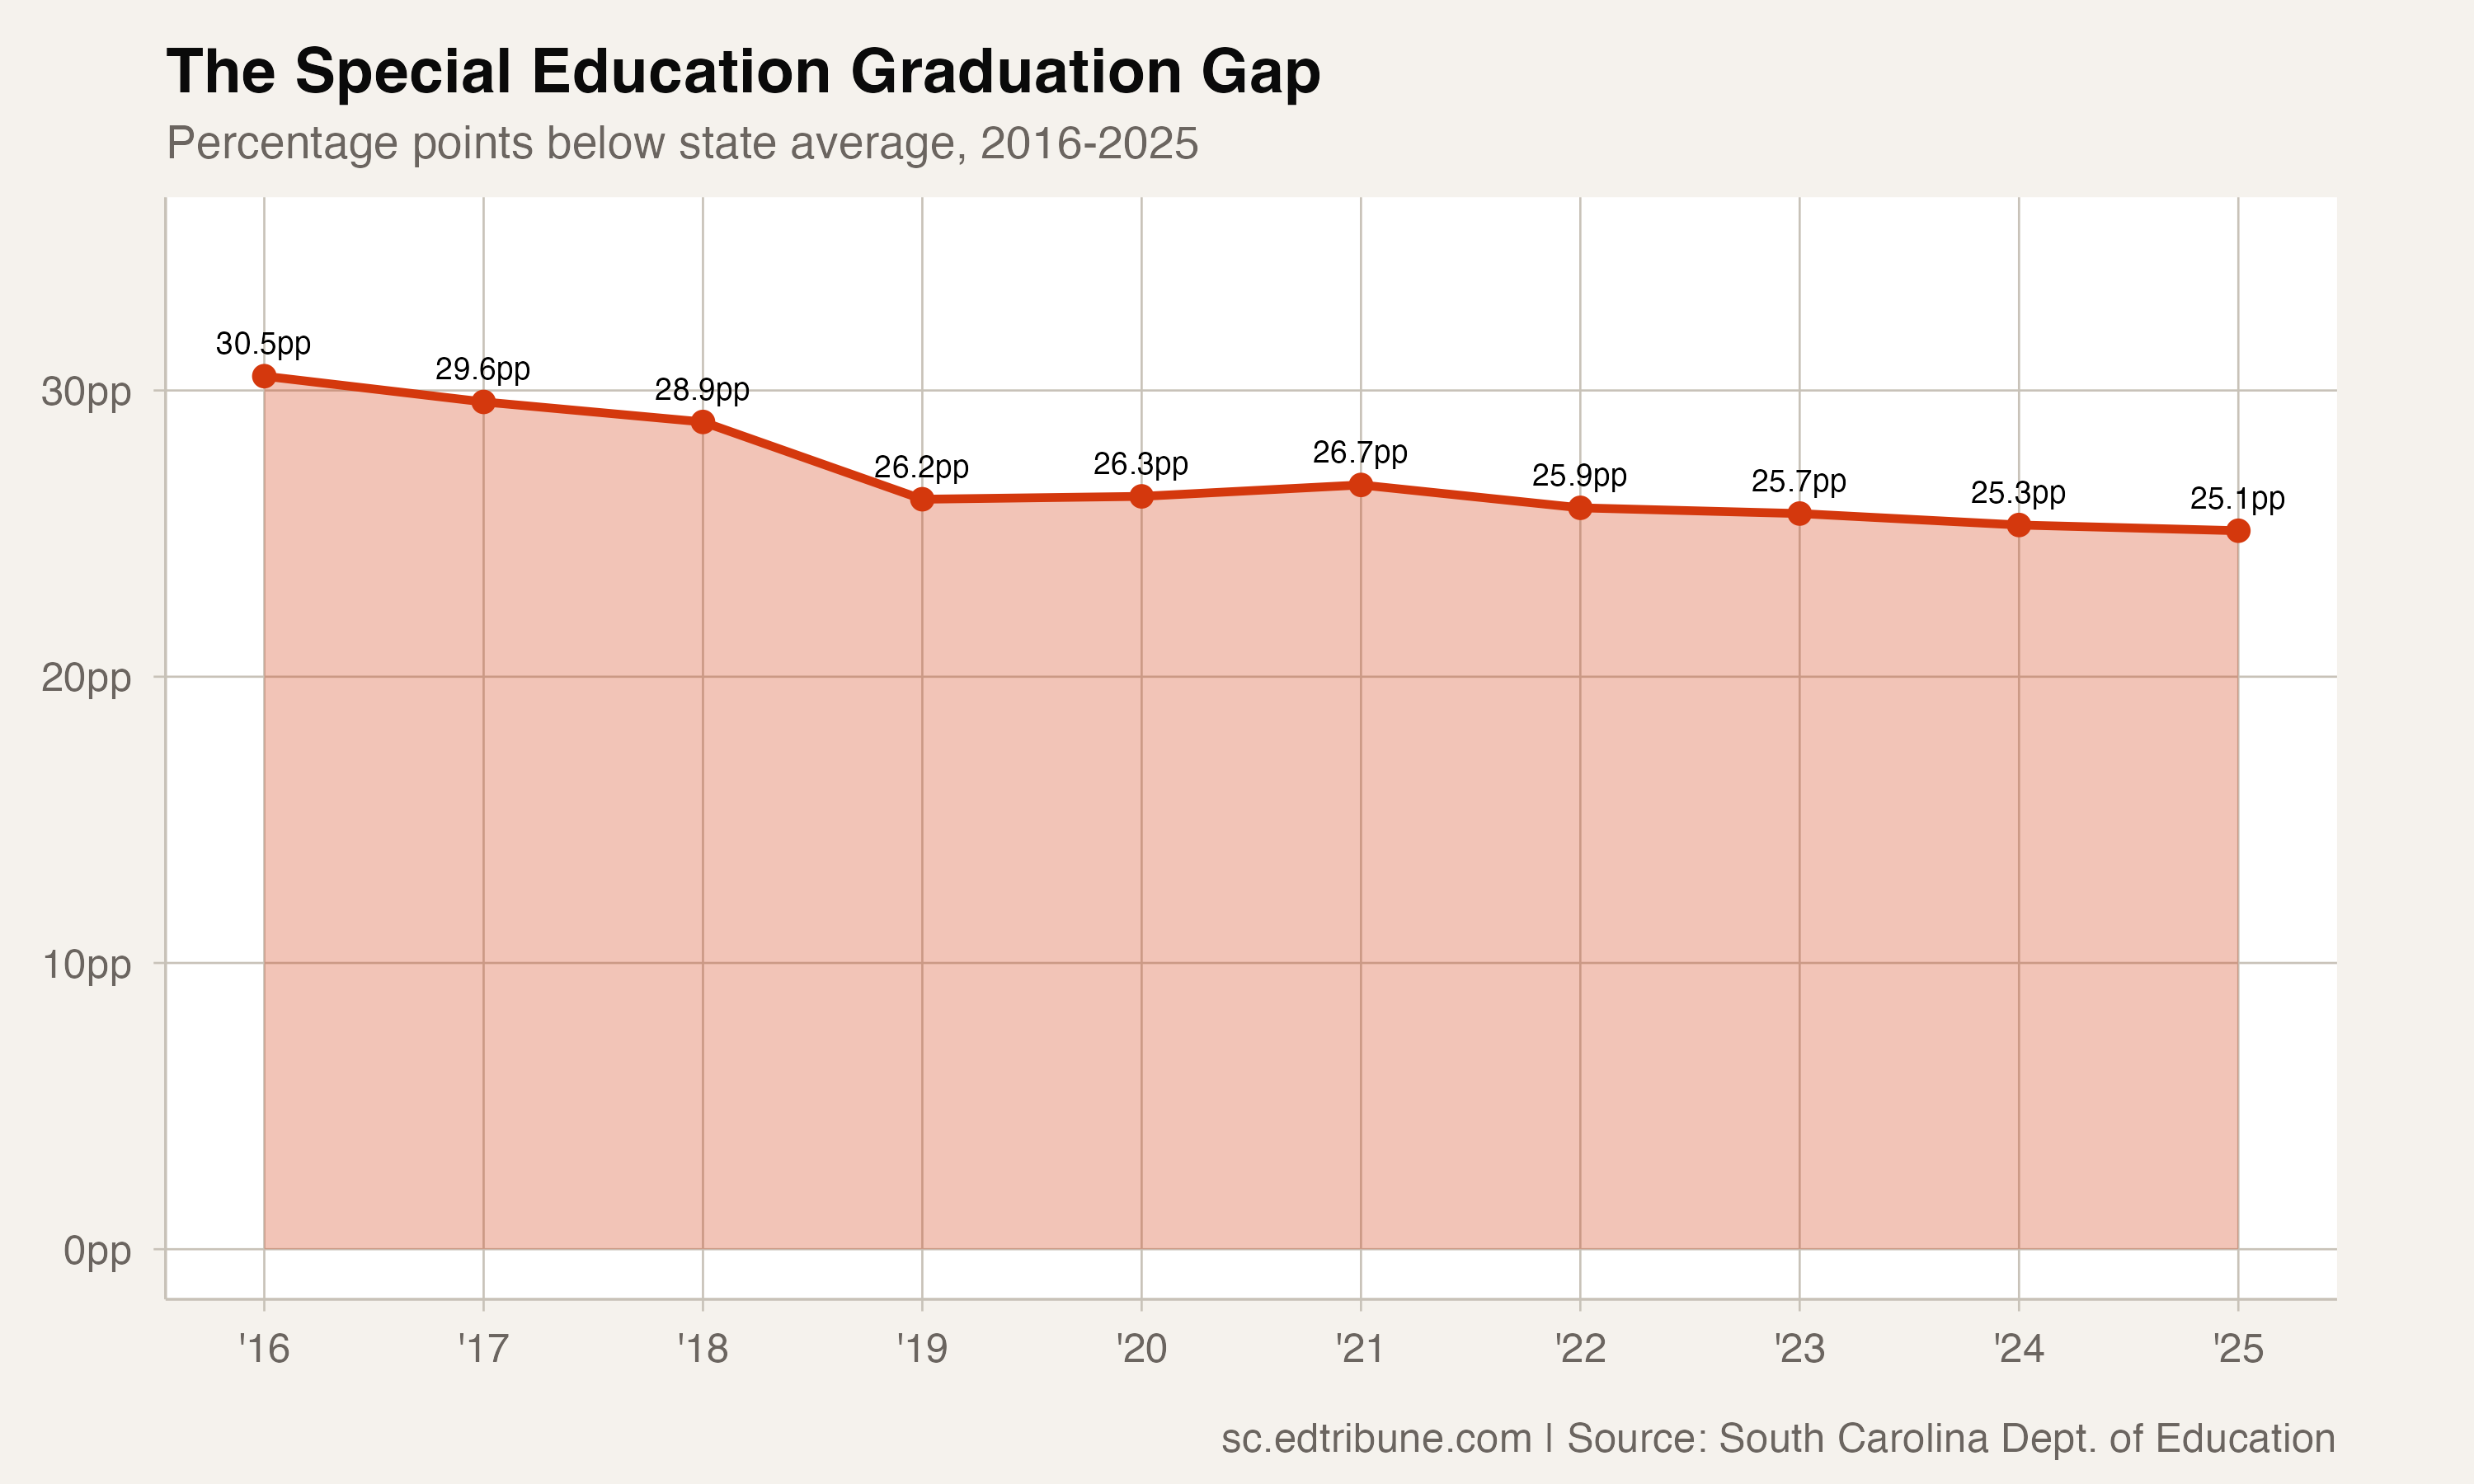
In 2016, the all-student rate was 82.6% and the special-education rate was 52.1%, a 30.5-point gap. By 2025, the all-student rate had gained 4.1 points while the special-education rate had gained 9.5 points. The endpoint gap narrowed by 5.4 points.
The path was not a continuous annual narrowing. The gap was 26.2 points in 2019, widened to 26.7 in 2021, then measured 25.9 in 2022, 25.7 in 2023, 25.3 in 2024, and 25.1 in 2025.
From 2023 to 2025 at the package's underlying precision, the all-student rate gained 2.8 points and the special-education rate gained 3.4. The gap narrowed by 0.6 points. Those observations establish what happened over the measured period; they do not establish a future date for parity.
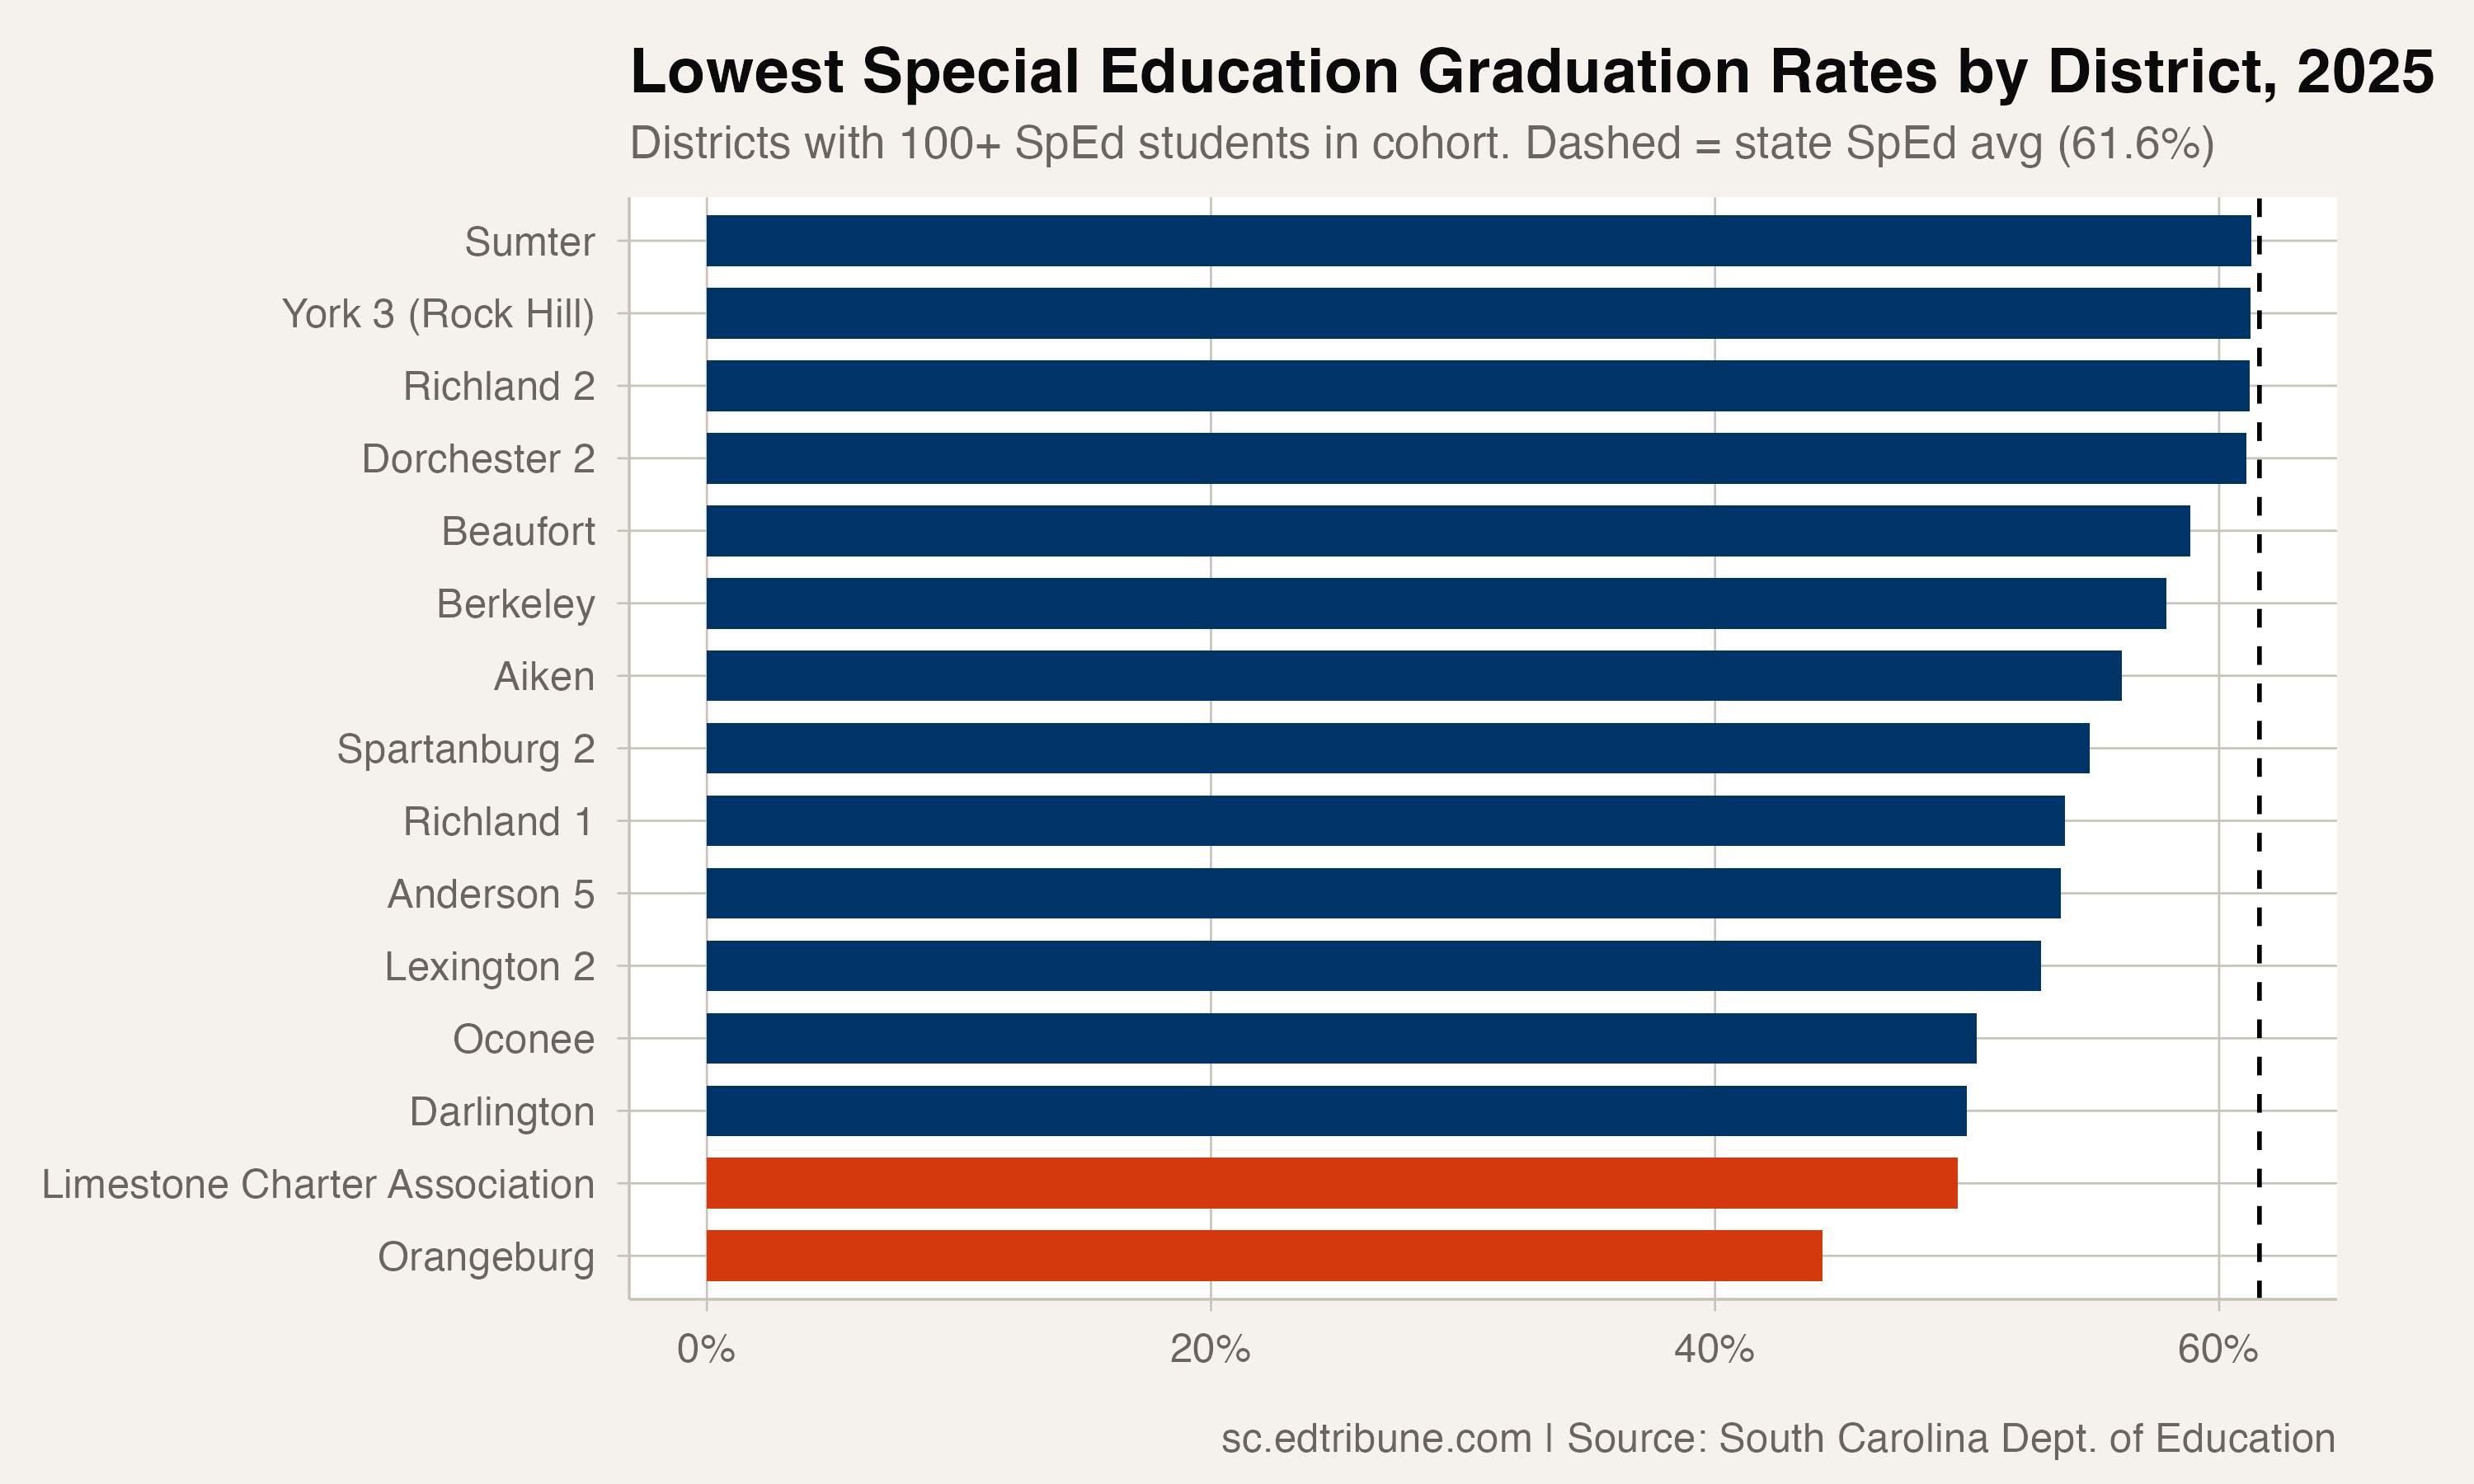
Eight larger district cohorts were below 55%
The package reported 29 districts with at least 100 students in their 2025 special-education cohort. Their rates ranged from 44.3% at Orangeburg↗ET to 80.6% at Anderson 1↗ET.
Eight of those districts were below 55%: Orangeburg at 44.3%, Limestone Charter Association at 49.6%, Darlington↗ET at 50.0%, Oconee at 50.4%, Lexington 2↗ET at 52.9%, Anderson 5 at 53.7%, Richland 1 at 53.9%, and Spartanburg 2 at 54.9%.
At the other end of the qualifying group, Anderson 1 reported 80.6%, York 4 (Fort Mill)↗ET 74.6%, Horry↗ET 70.1%, and Greenville↗ET 69.9%.
Greenville had the largest qualifying special-education cohort in 2025, with 856 students. Its rate rose from 50.8% for a cohort of 744 students in 2018 to 69.9% in 2025, a 19.1-point increase. Those aggregate rows show a larger cohort and a higher reported rate; they do not identify why the rate changed.
Detailed code that reproduces the analysis and figures in this article is available exclusively to EdTribune subscribers.
Discussion
Sign in to join the discussion.
Loading comments...