South Carolina spent four years clawing back every student it lost to COVID. It recovered 148% of its pandemic losses, surpassing its pre-pandemic enrollment and reaching a record 796,780 students in 2024-25. Then, in a single year, it gave back 7,694 of them.
The state now enrolls 789,086 students, a 1.0% decline that is both the largest non-COVID drop in the dataset and the only decline year outside the pandemic since records begin in 2014-15. South Carolina never reached 800,000. It came within 3,220 students of that milestone and turned around.
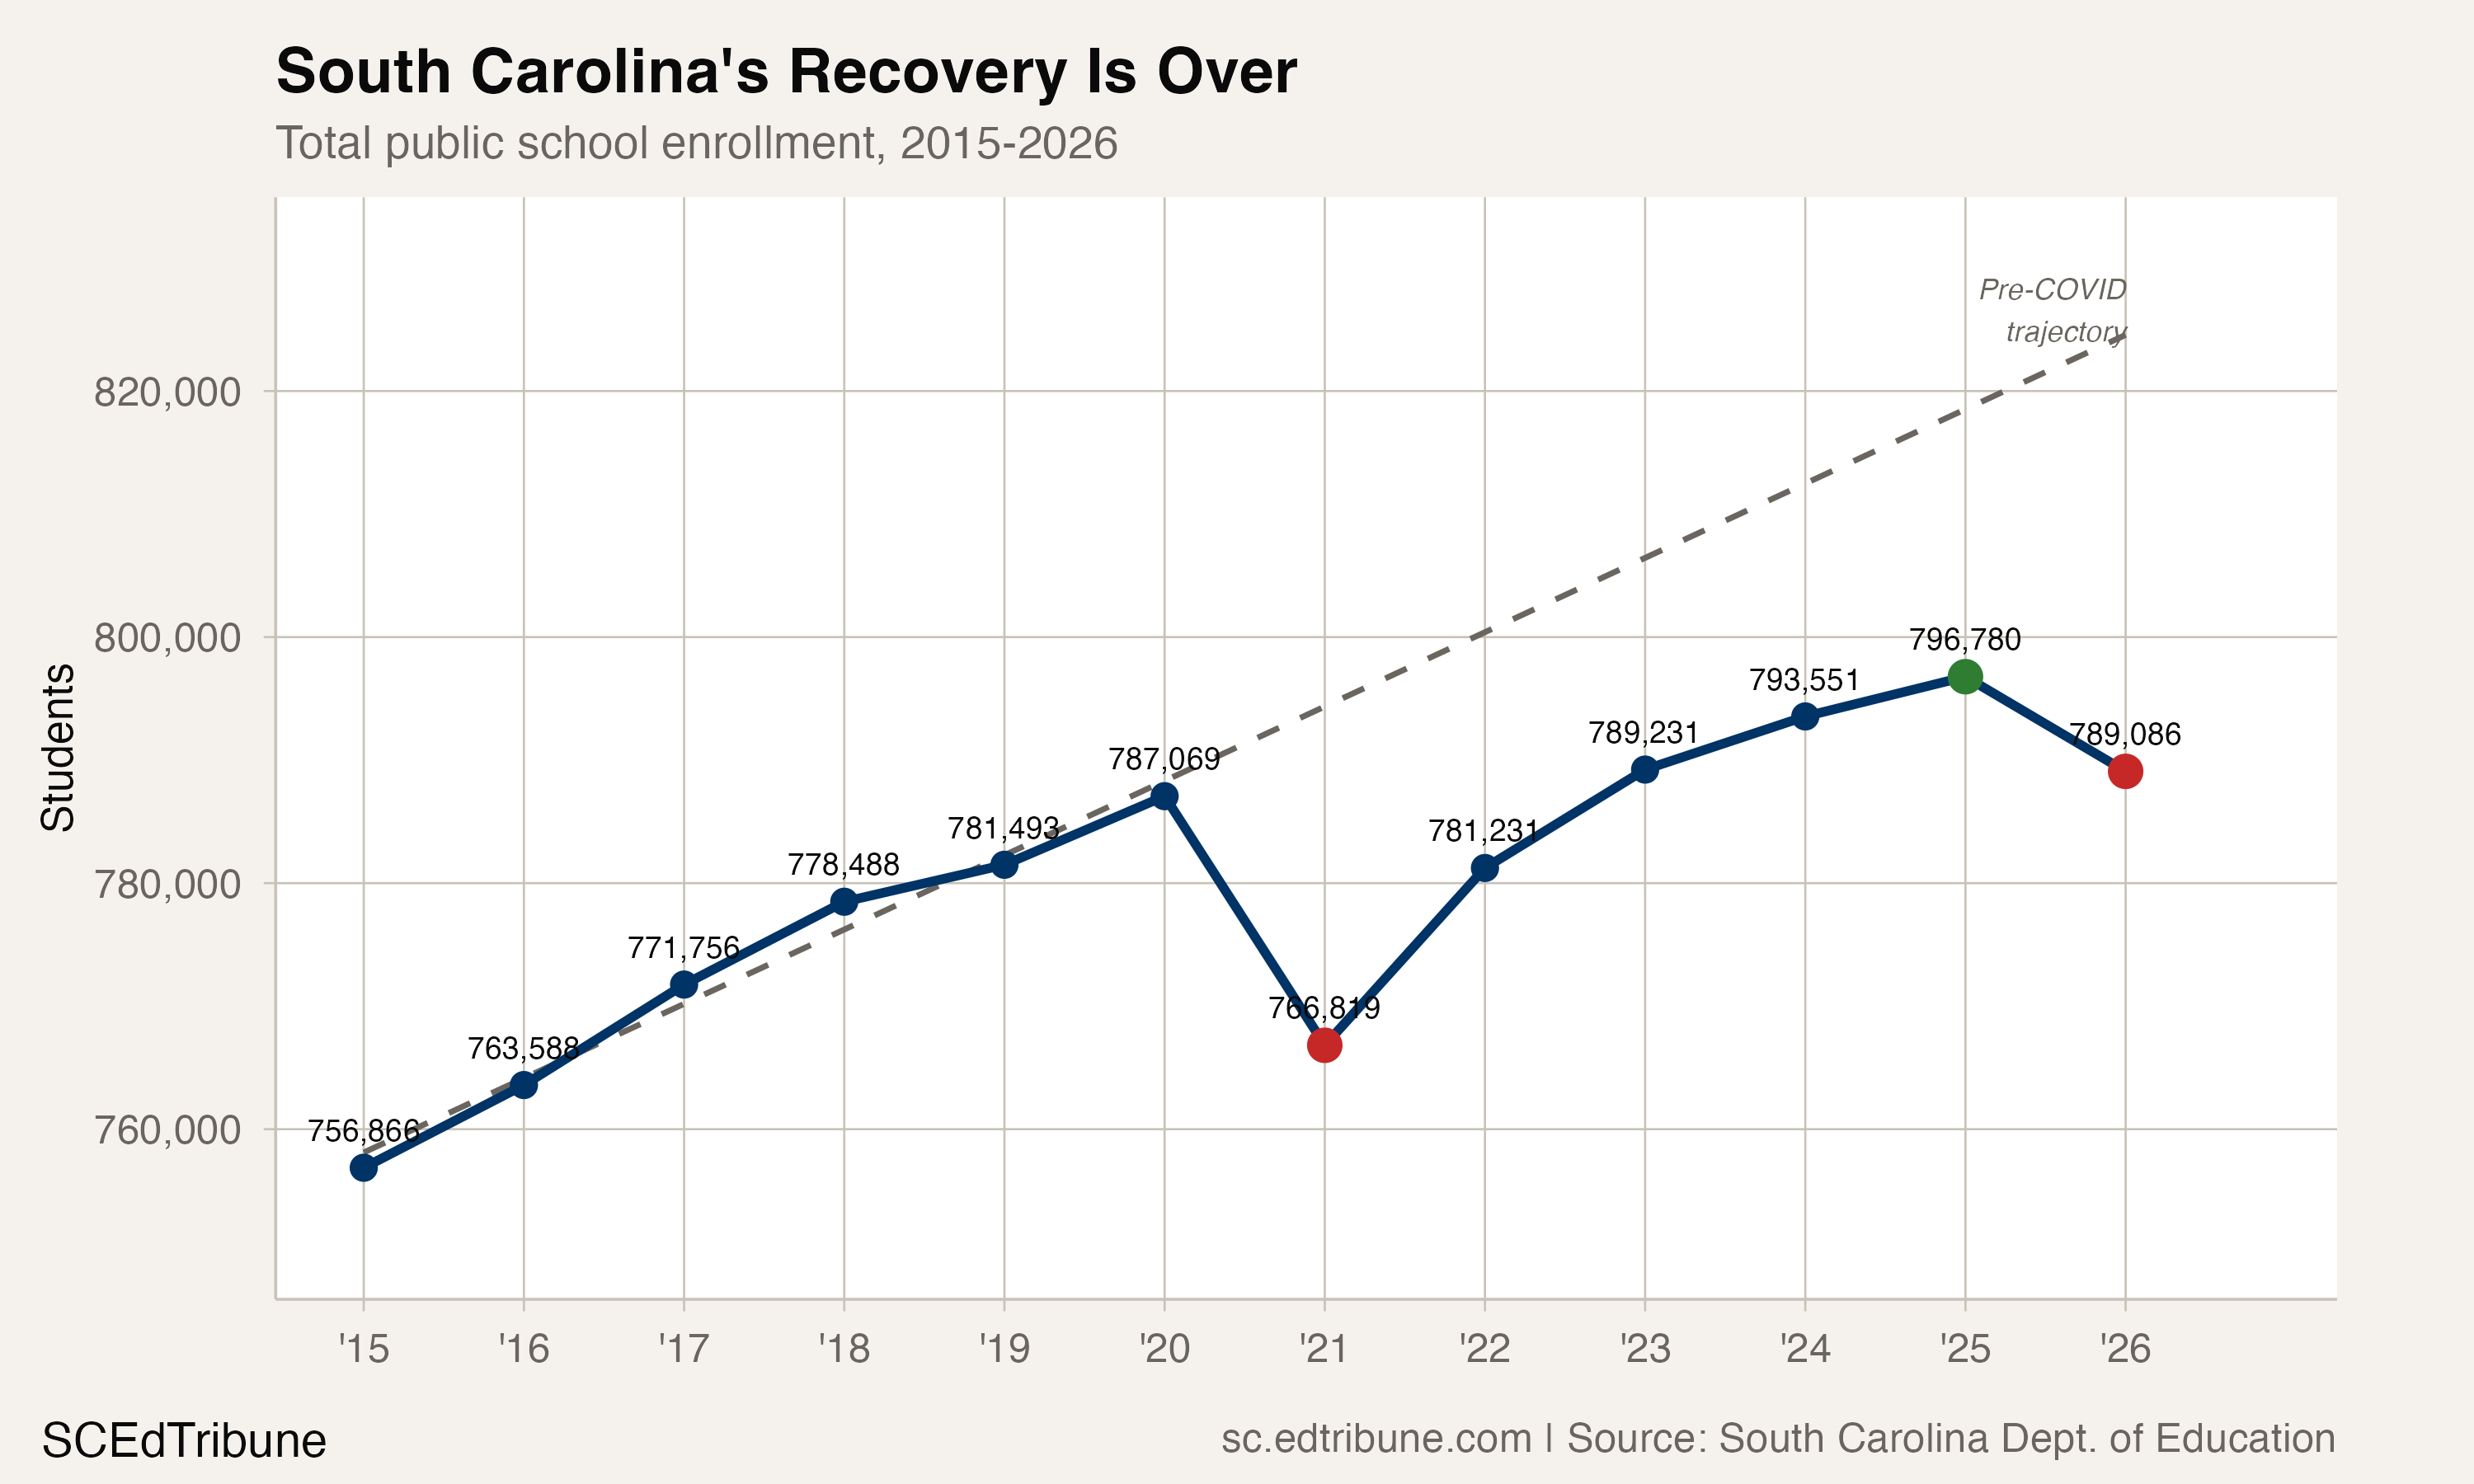
Four recovery years, then a cliff
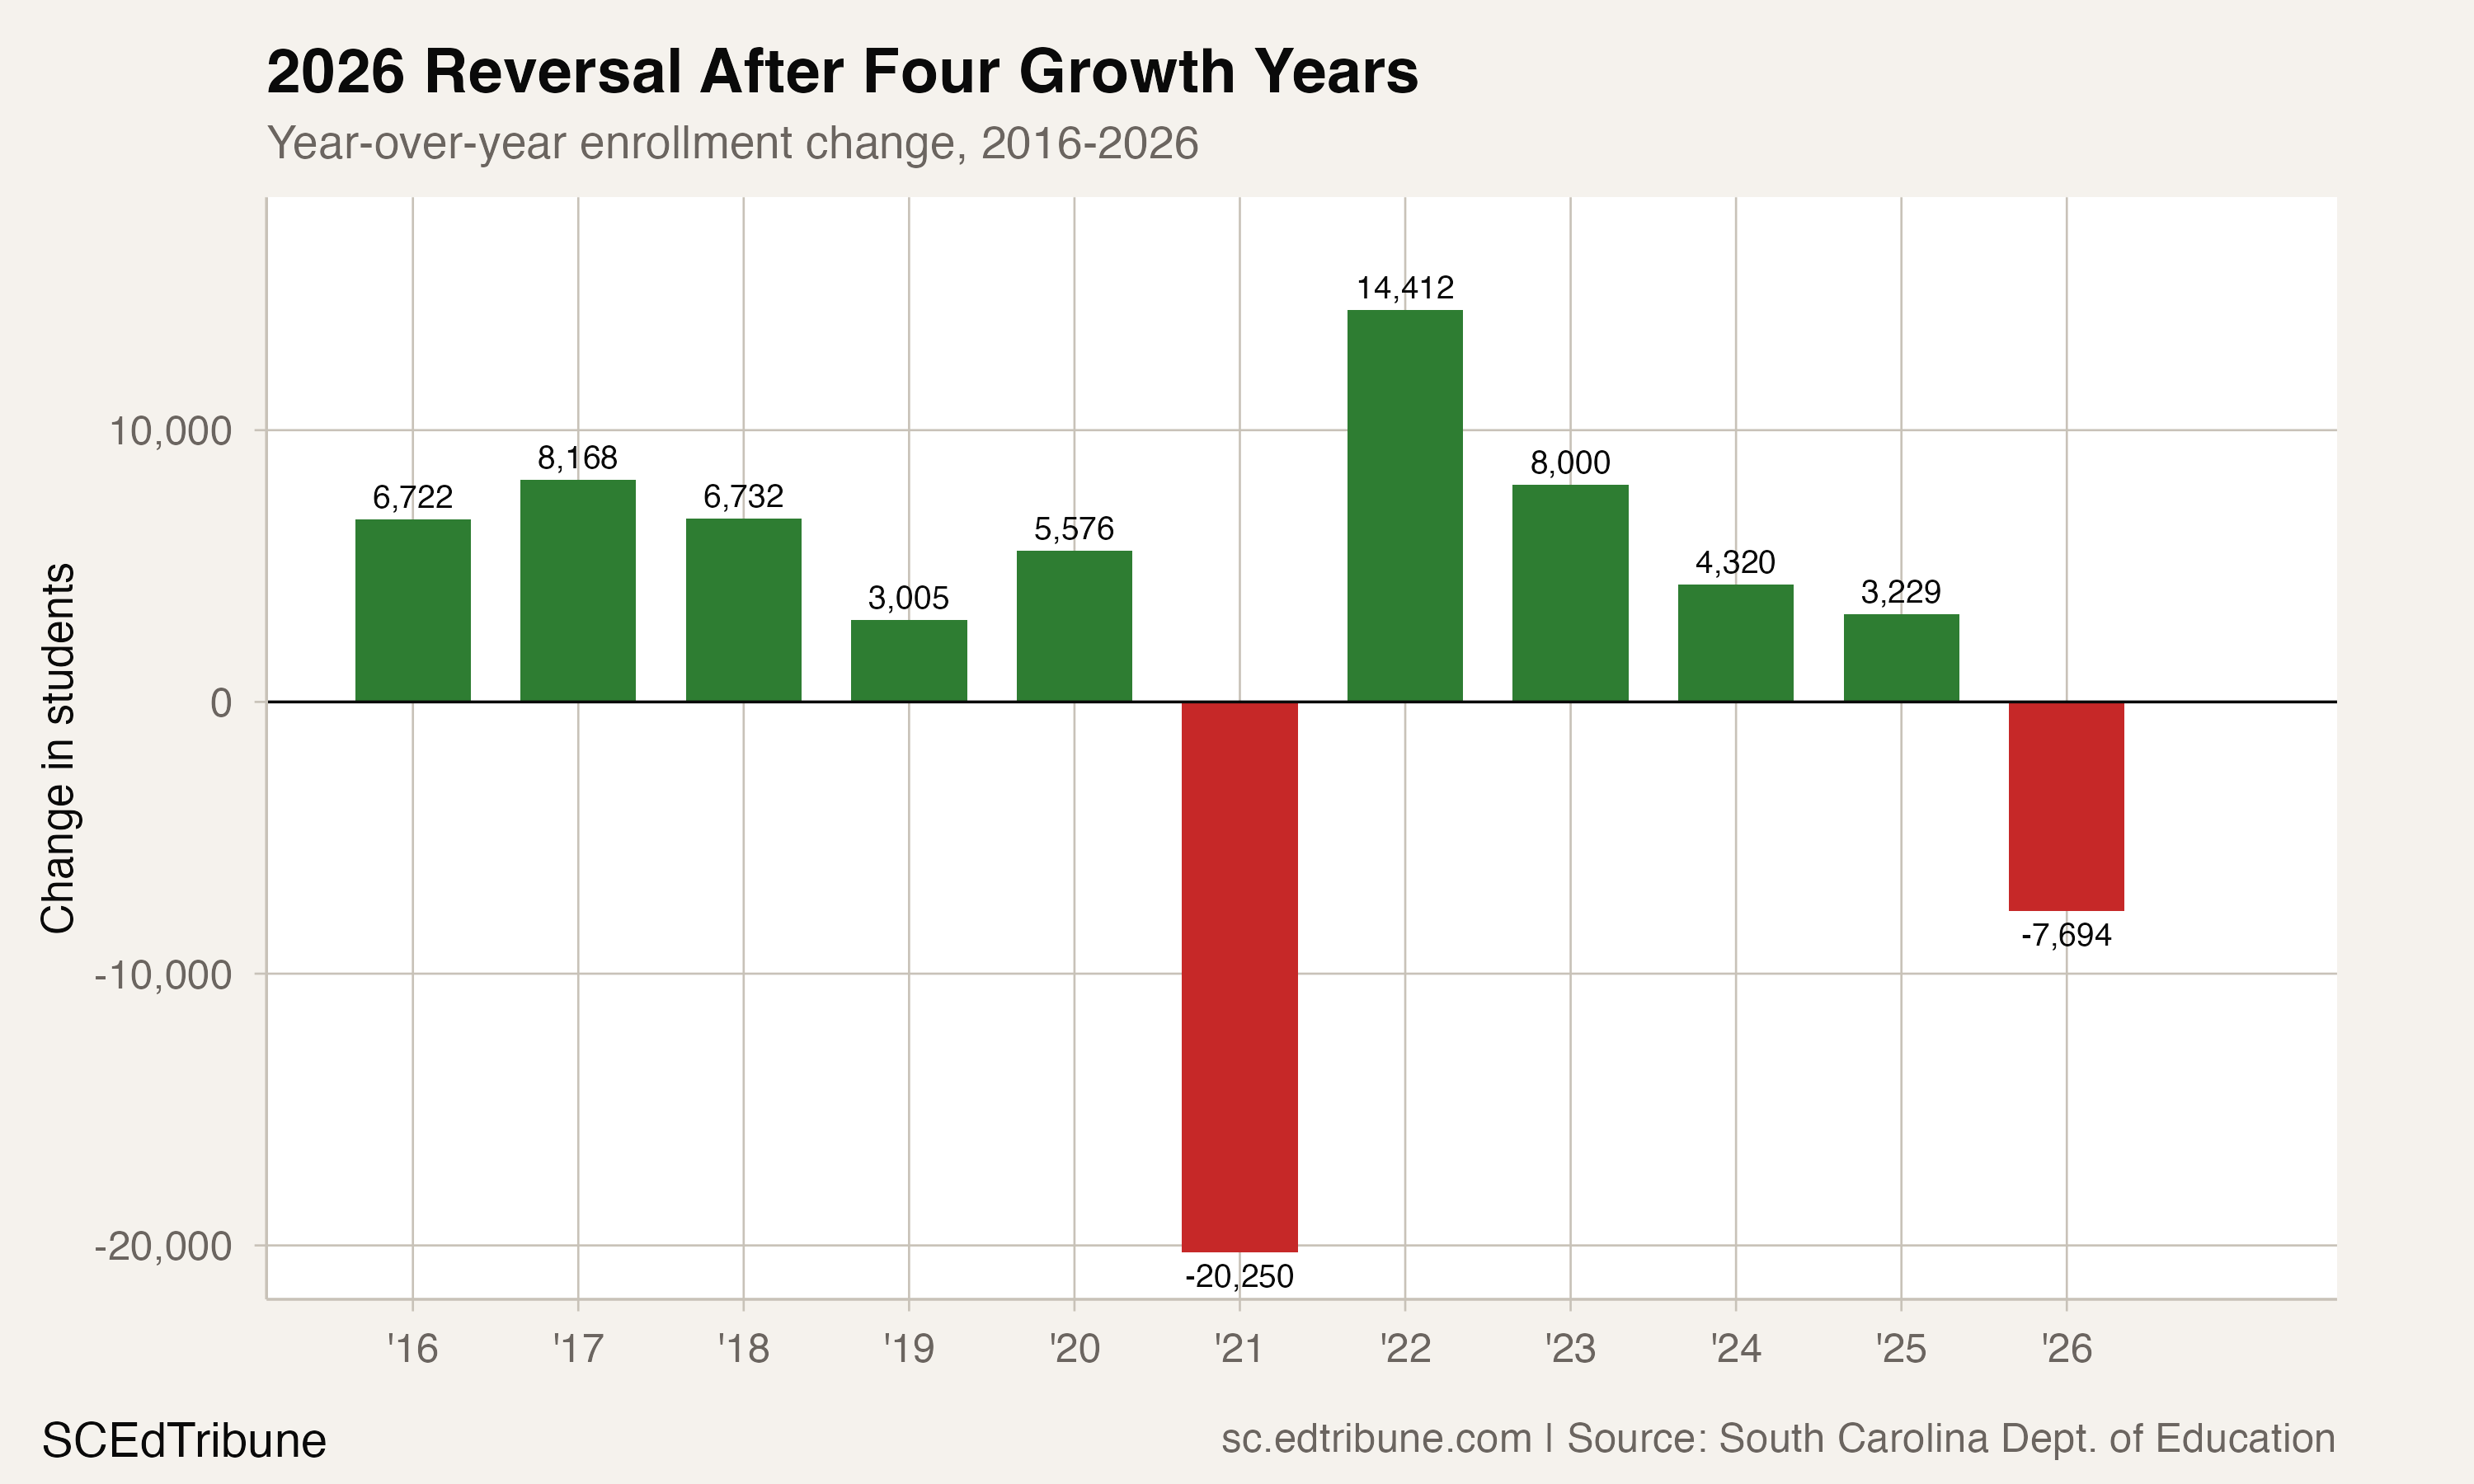
The trajectory is worth spelling out. South Carolina grew steadily from 756,866 in 2014-15 to 787,069 in 2019-20, adding 30,203 students at roughly 5,000 to 8,000 per year. COVID cut 20,250 students in a single year, dropping enrollment to 766,819. The state bounced back with a 14,412-student surge in 2021-22, the strongest single-year gain in the dataset, followed by three more years of growth: 8,000, then 4,320, then 3,229.
Each year of recovery was smaller than the last. The deceleration was visible by 2023-24, when gains dropped below 5,000 for the first time since the rebound began. By 2024-25, growth had slowed to 3,229 students, 0.4%. Then 2025-26 arrived with a loss of 7,694, larger than any two consecutive recovery years combined.
The state remains 2,017 students above its 2019-20 pre-COVID level. But it sits 35,479 below where the pre-COVID growth trajectory (2014-15 through 2019-20) would have placed it, a gap that widened in 2025-26.
The pipeline is shrinking
The most likely driver of the reversal is demographic, not pandemic-related. Kindergarten enrollment has fallen 9.2% since 2014-15, from 58,359 to 52,969. Grade 12, meanwhile, has grown 21.7%, from 45,626 to 55,515. In 2024-25, for the first time in the dataset, South Carolina enrolled more 12th graders than kindergartners. The K-to-G12 ratio dropped from 127.9 in 2014-15 to 95.4 in 2025-26.
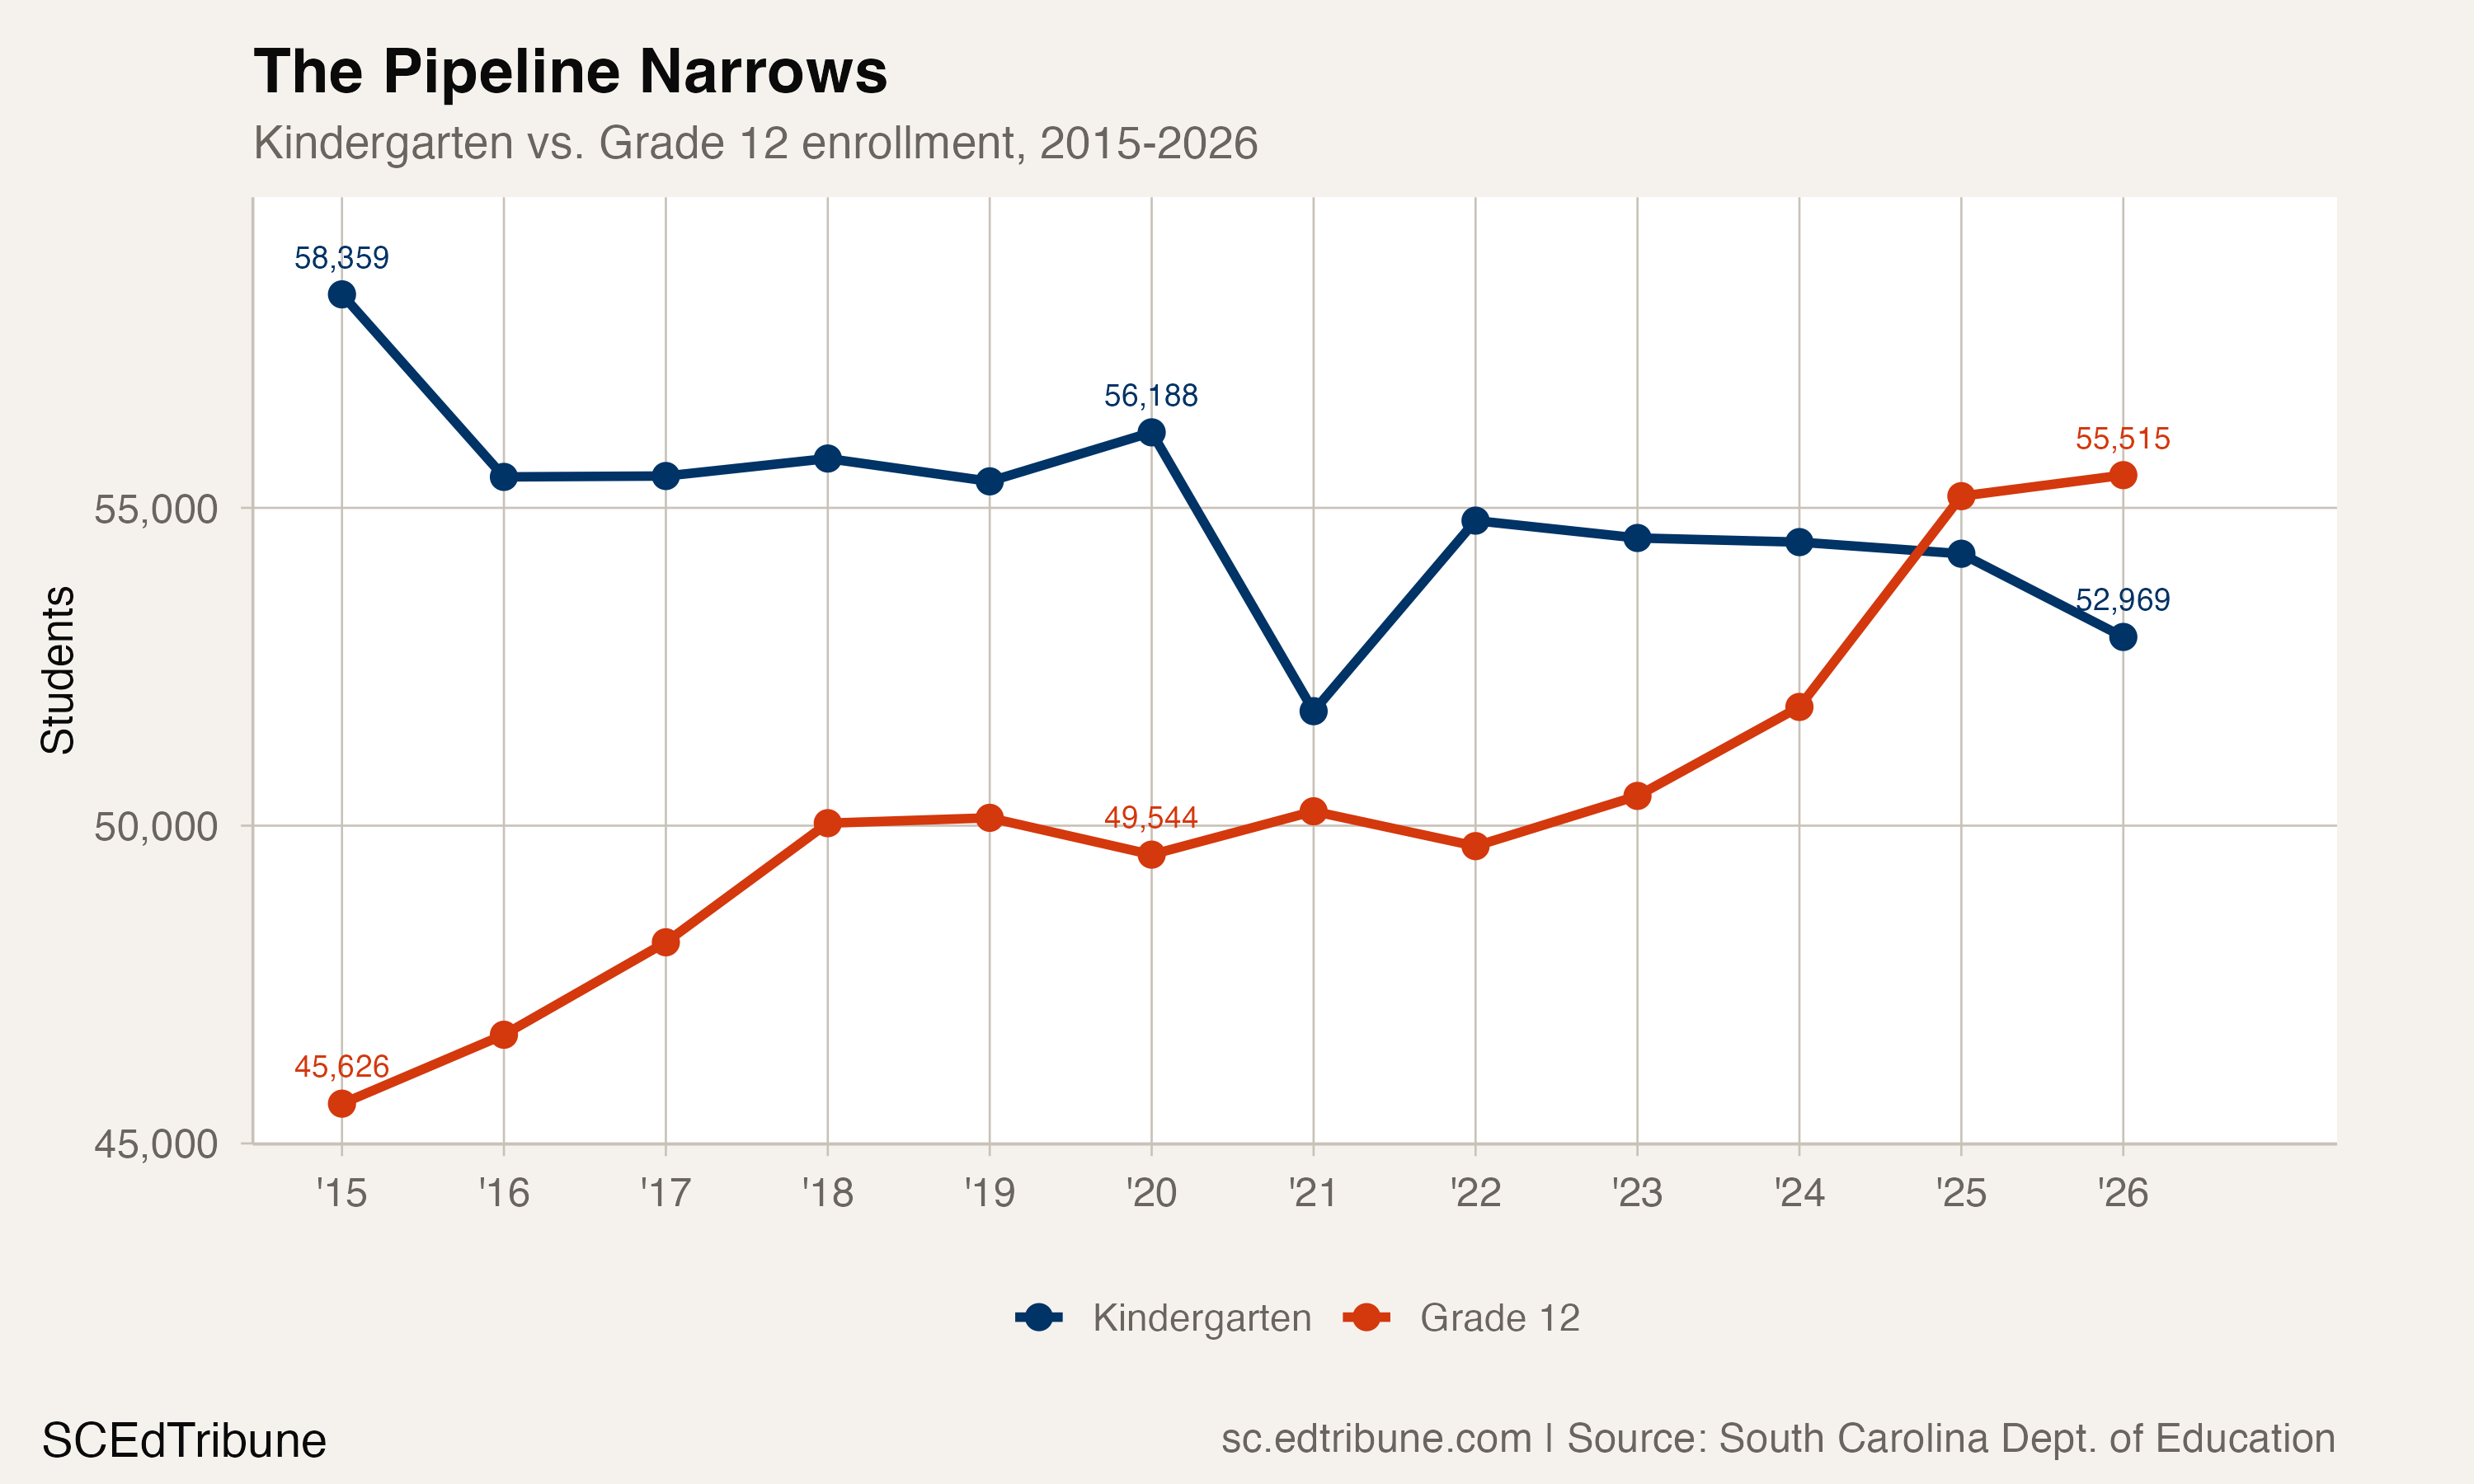
This is a pipeline problem. Large graduating classes are leaving the system faster than smaller incoming cohorts can replace them. First grade is down 7.3% over the period, second grade down 5.8%. Every grade from third through 12th has grown. The system is top-heavy, and each year of 12th-grade departures removes a larger cohort than the kindergarten class entering at the bottom.
South Carolina's fertility rate fell to 55.8 per 1,000 women aged 15-44 in 2023, continuing a national trend of declining births. Children born in 2019-20, when South Carolina's child care crisis was already deepening, are now entering kindergarten. The shrinking pipeline is not unique to South Carolina, but the state's abrupt reversal from growth to decline makes the structural shift harder to absorb.
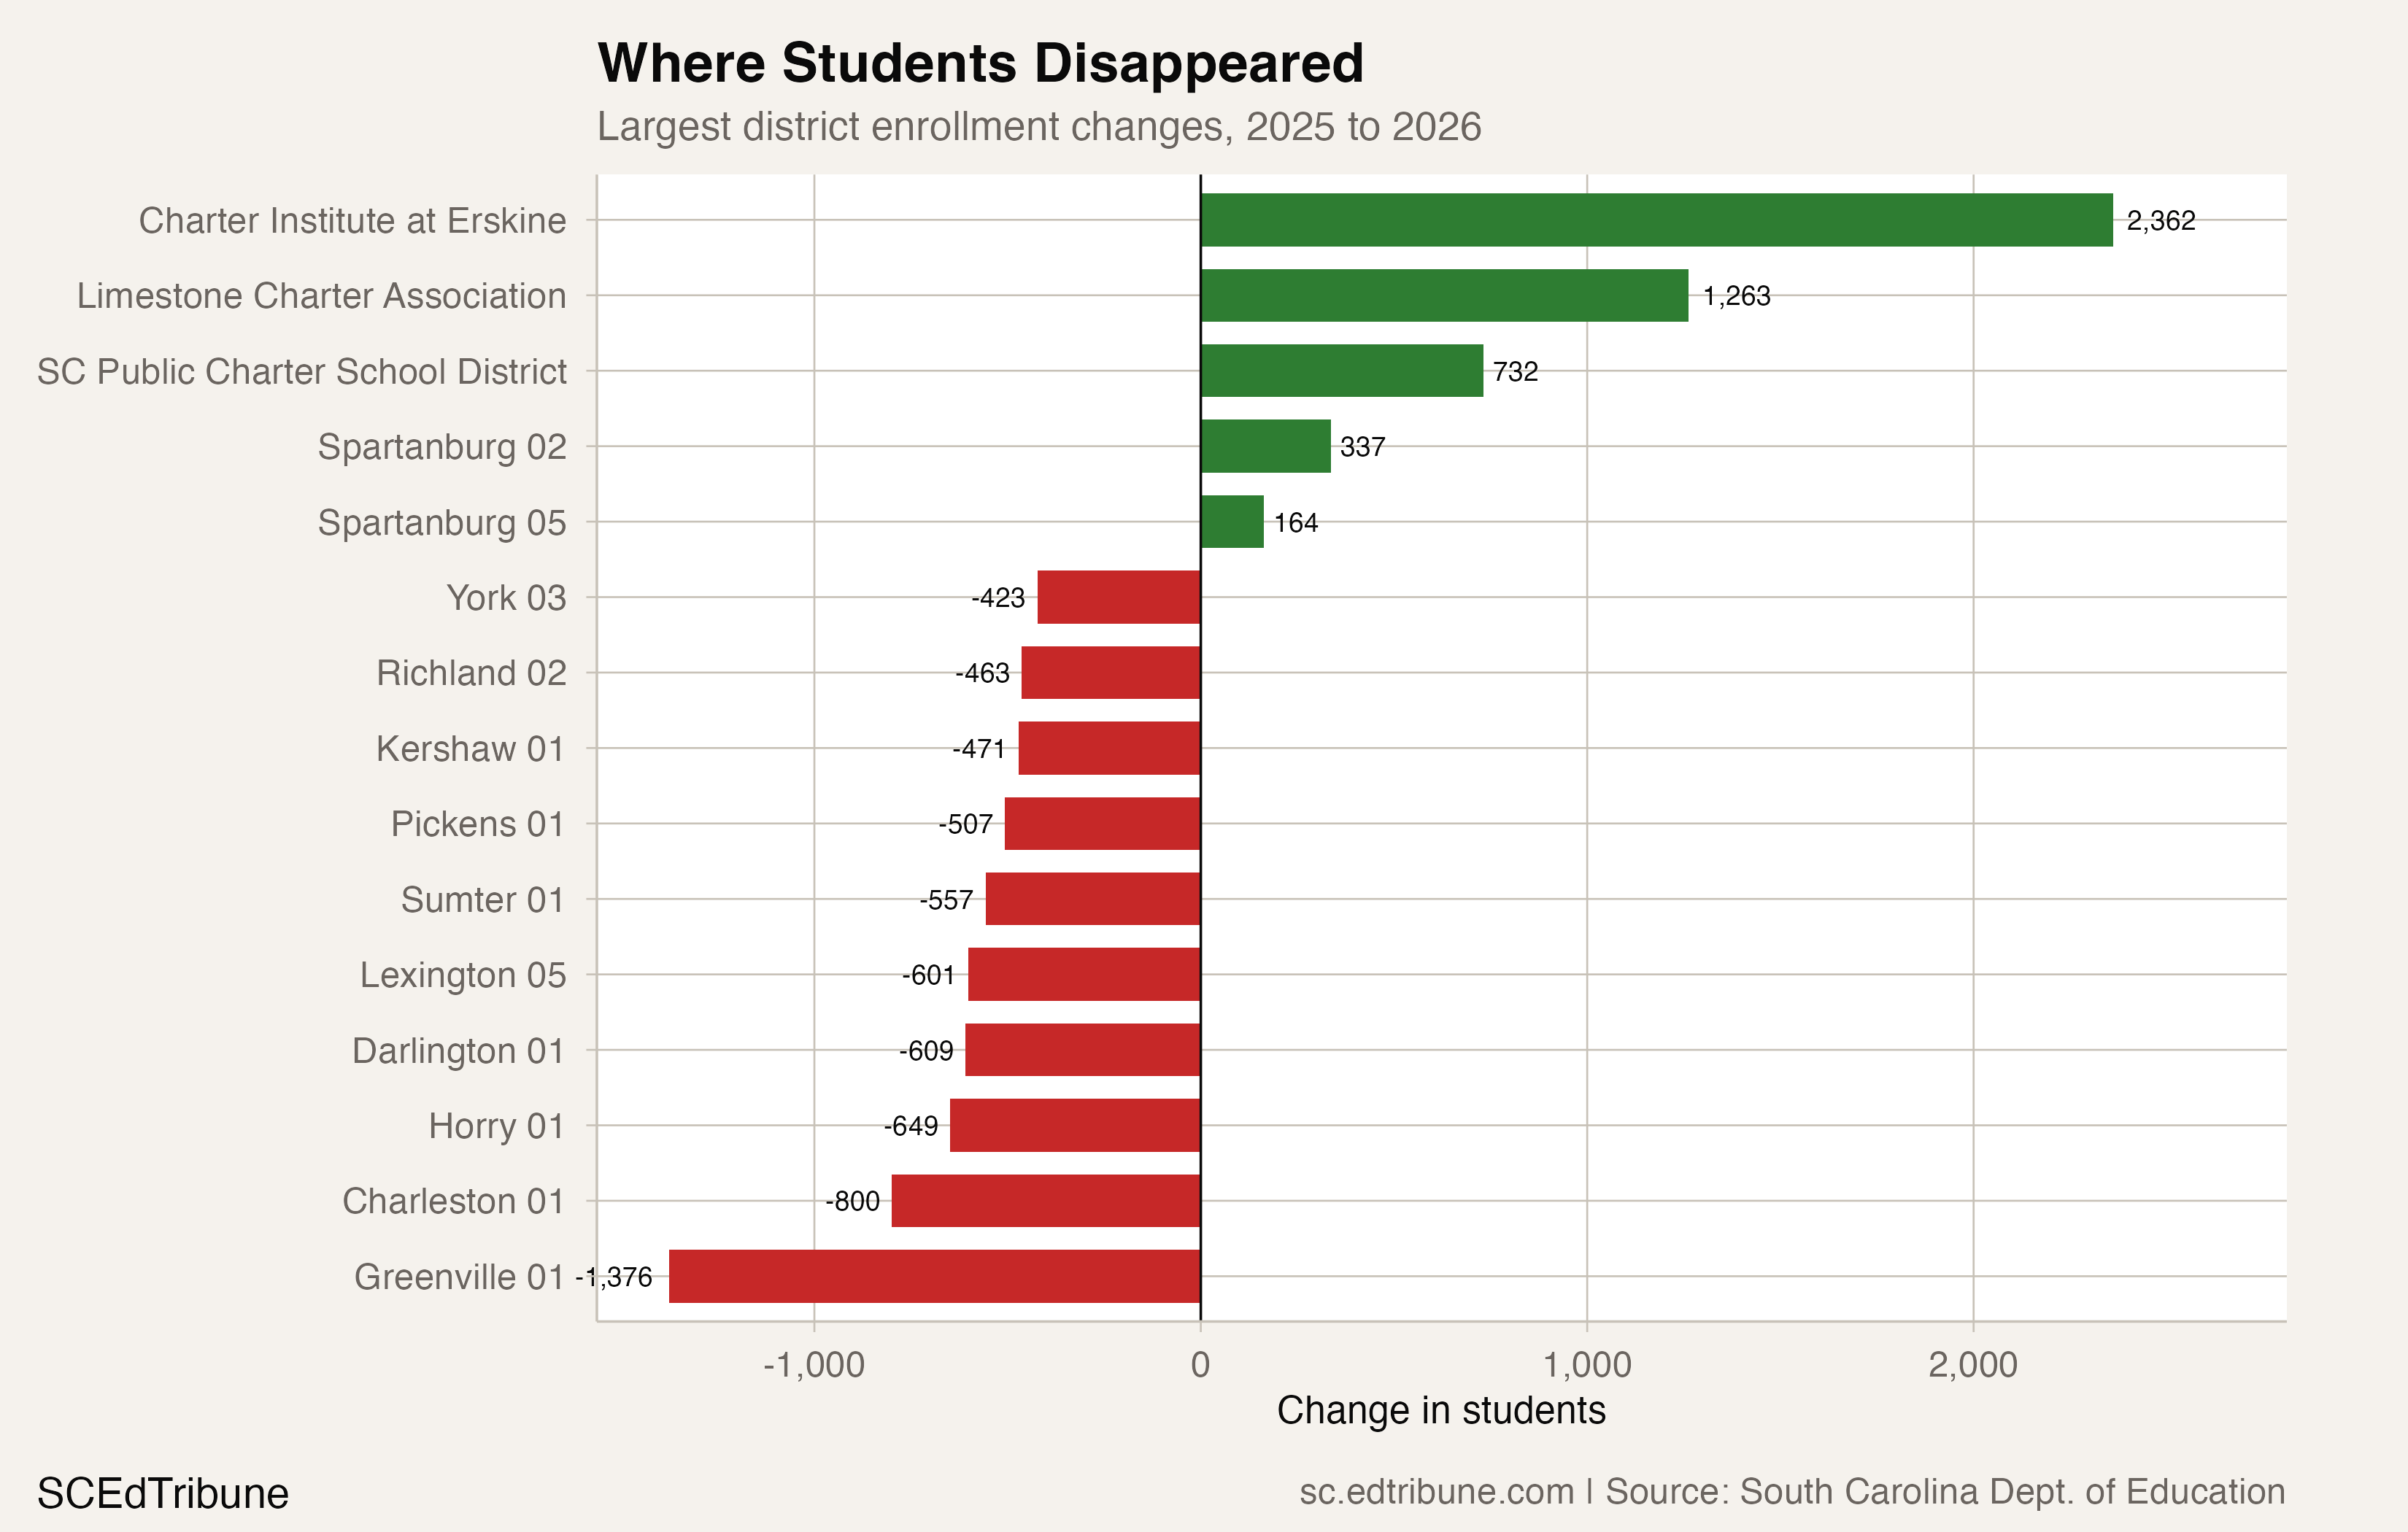
61 districts lost students. Three charter operators gained.
The 2025-26 decline hit 59 of the state's 81 districts. Only 15 gained students, and just 10 of those are traditional districts.
Greenville 01↗ET, the state's largest district, led the losses with 1,376 fewer students, a 1.8% decline. Charleston 01↗ET lost 800, Horry 01↗ET lost 649, and Darlington 01↗ET lost 609, a 6.9% drop that stands out for its severity in a mid-sized district enrolling just over 8,000. The five largest losses accounted for 52.4% of the total decline.
Greenville County Schools has now lost students for two consecutive years, down from a peak of 78,364 in 2023-24. The district has attributed some of the decline to charter competition, with 6,113 Greenville County students enrolled in charter schools, alongside a drop in kindergarten enrollment and a decline in students with limited English proficiency.
The three charter operators, by contrast, added a combined 4,357 students. Charter Institute at Erskine↗ET grew by 2,362 (9.1%), Limestone Charter Association by 1,263 (17.1%), and SC Public Charter School District by 732 (3.4%). Charter operators accounted for 7.5% of total enrollment in 2025-26, up from 2.2% in 2014-15.
Charter growth and the zero-sum question
Charter enrollment has more than tripled since 2014-15, rising from 17,024 to 59,141. Traditional district enrollment has moved in the opposite direction, declining from 739,842 to 729,945 over the same period, a loss of 9,897 students even as the state total grew by 32,220.
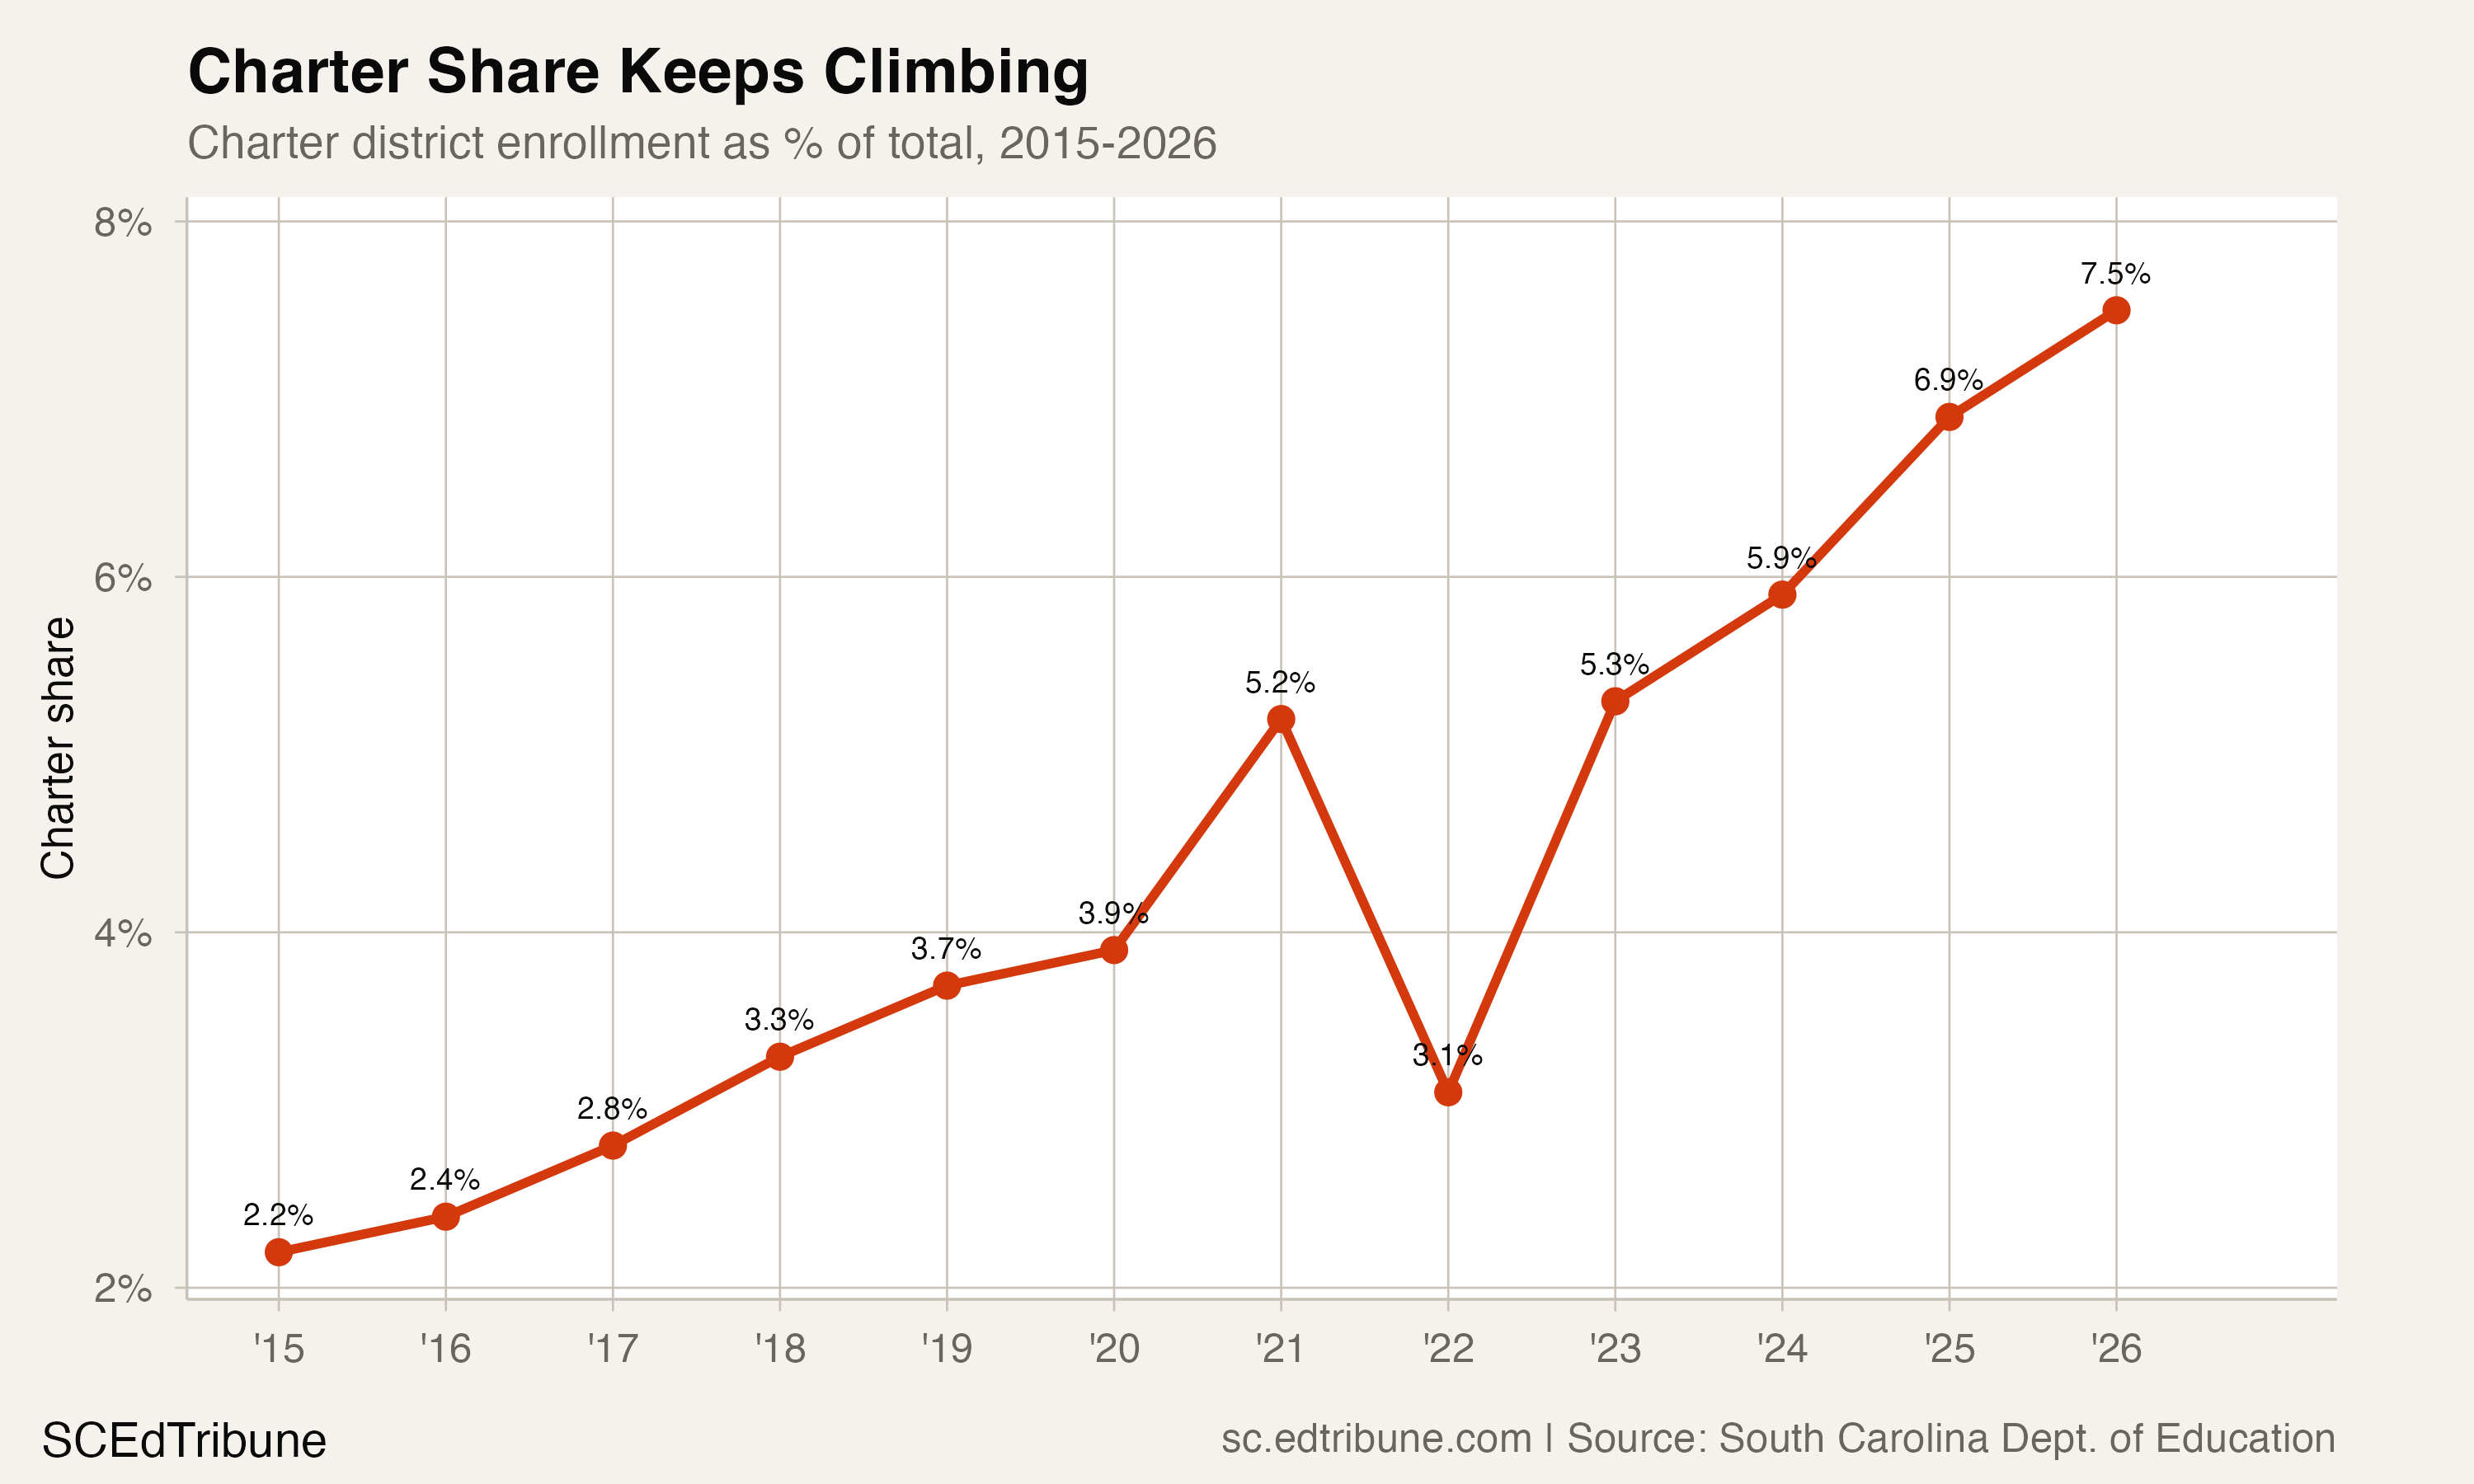
The charter share chart shows a discontinuity in 2021-22, when SC Public Charter School District did not report enrollment and Limestone Charter Association had not yet been established as a separate reporting entity. The 3.1% figure for that year understates the charter sector's actual size.
Whether charter growth is pulling students from traditional districts or absorbing students who would otherwise leave public education entirely is an open question. Both dynamics are plausible. The Charter Institute at Erskine serves 26 schools and 27,000 students and has positioned itself as the fastest-growing district-equivalent entity in the state, with 2,800 additional students in its approved new-school pipeline. At its current growth rate, the Institute alone will enroll more students than all but three traditional districts in the state.
Separately, the state's Education Scholarship Trust Fund awarded 10,000 scholarships of $7,500 each for 2025-26, enabling families to use state funds for private school tuition and other educational expenses. The program is set to expand to 15,000 scholarships in 2026-27, with eligibility reaching 500% of the federal poverty level, roughly 85% of South Carolina children. Whether the ESA program has materially affected public school enrollment is not yet clear from the data. A one-year, 7,694-student decline in a system of 789,086 could reflect ESA departures, pipeline shrinkage, or both.
Nearly half of all districts at a record low
Thirty-four of the state's 81 districts, 42.0%, are at their lowest enrollment in the 12-year dataset. The list spans rural districts that have been declining for years, like Darlington 01 and Marlboro 01, and larger districts that peaked more recently, like Richland 01↗ET at 21,468 and Lexington 05 at 16,452.
Only 17 of the 71 districts that lost students during COVID, 23.9%, have recovered to their pre-pandemic levels. South Carolina's statewide recovery masked the fact that most districts never fully recovered, and 2025-26 pushed many further from their pre-COVID baselines.
"Enrollment declines will hurt rural districts the hardest. Marlboro County isn't going to be the last district that faces this demographic problem." Source: Post and Courier, editorial
South Carolina's Education Finance Act formula distributes state funds based on weighted pupil units. When enrollment drops, funding follows. For districts like Darlington, which lost 6.9% in a single year, the fiscal adjustment is not gradual. It is immediate.
What to watch next
The 2026-27 kindergarten cohort was born in 2020-21, when U.S. births dropped sharply. If that cohort is smaller than the current one, the decline accelerates. Meanwhile, the ESA program's expansion to 15,000 scholarships creates a second source of potential outflow from public schools.
South Carolina spent four years proving that a state can fully recover from COVID enrollment losses. It took one year to prove that recovery and long-term growth are different things.
Detailed code that reproduces the analysis and figures in this article is available exclusively to EdTribune subscribers.
Discussion
Sign in to join the discussion.
Loading comments...