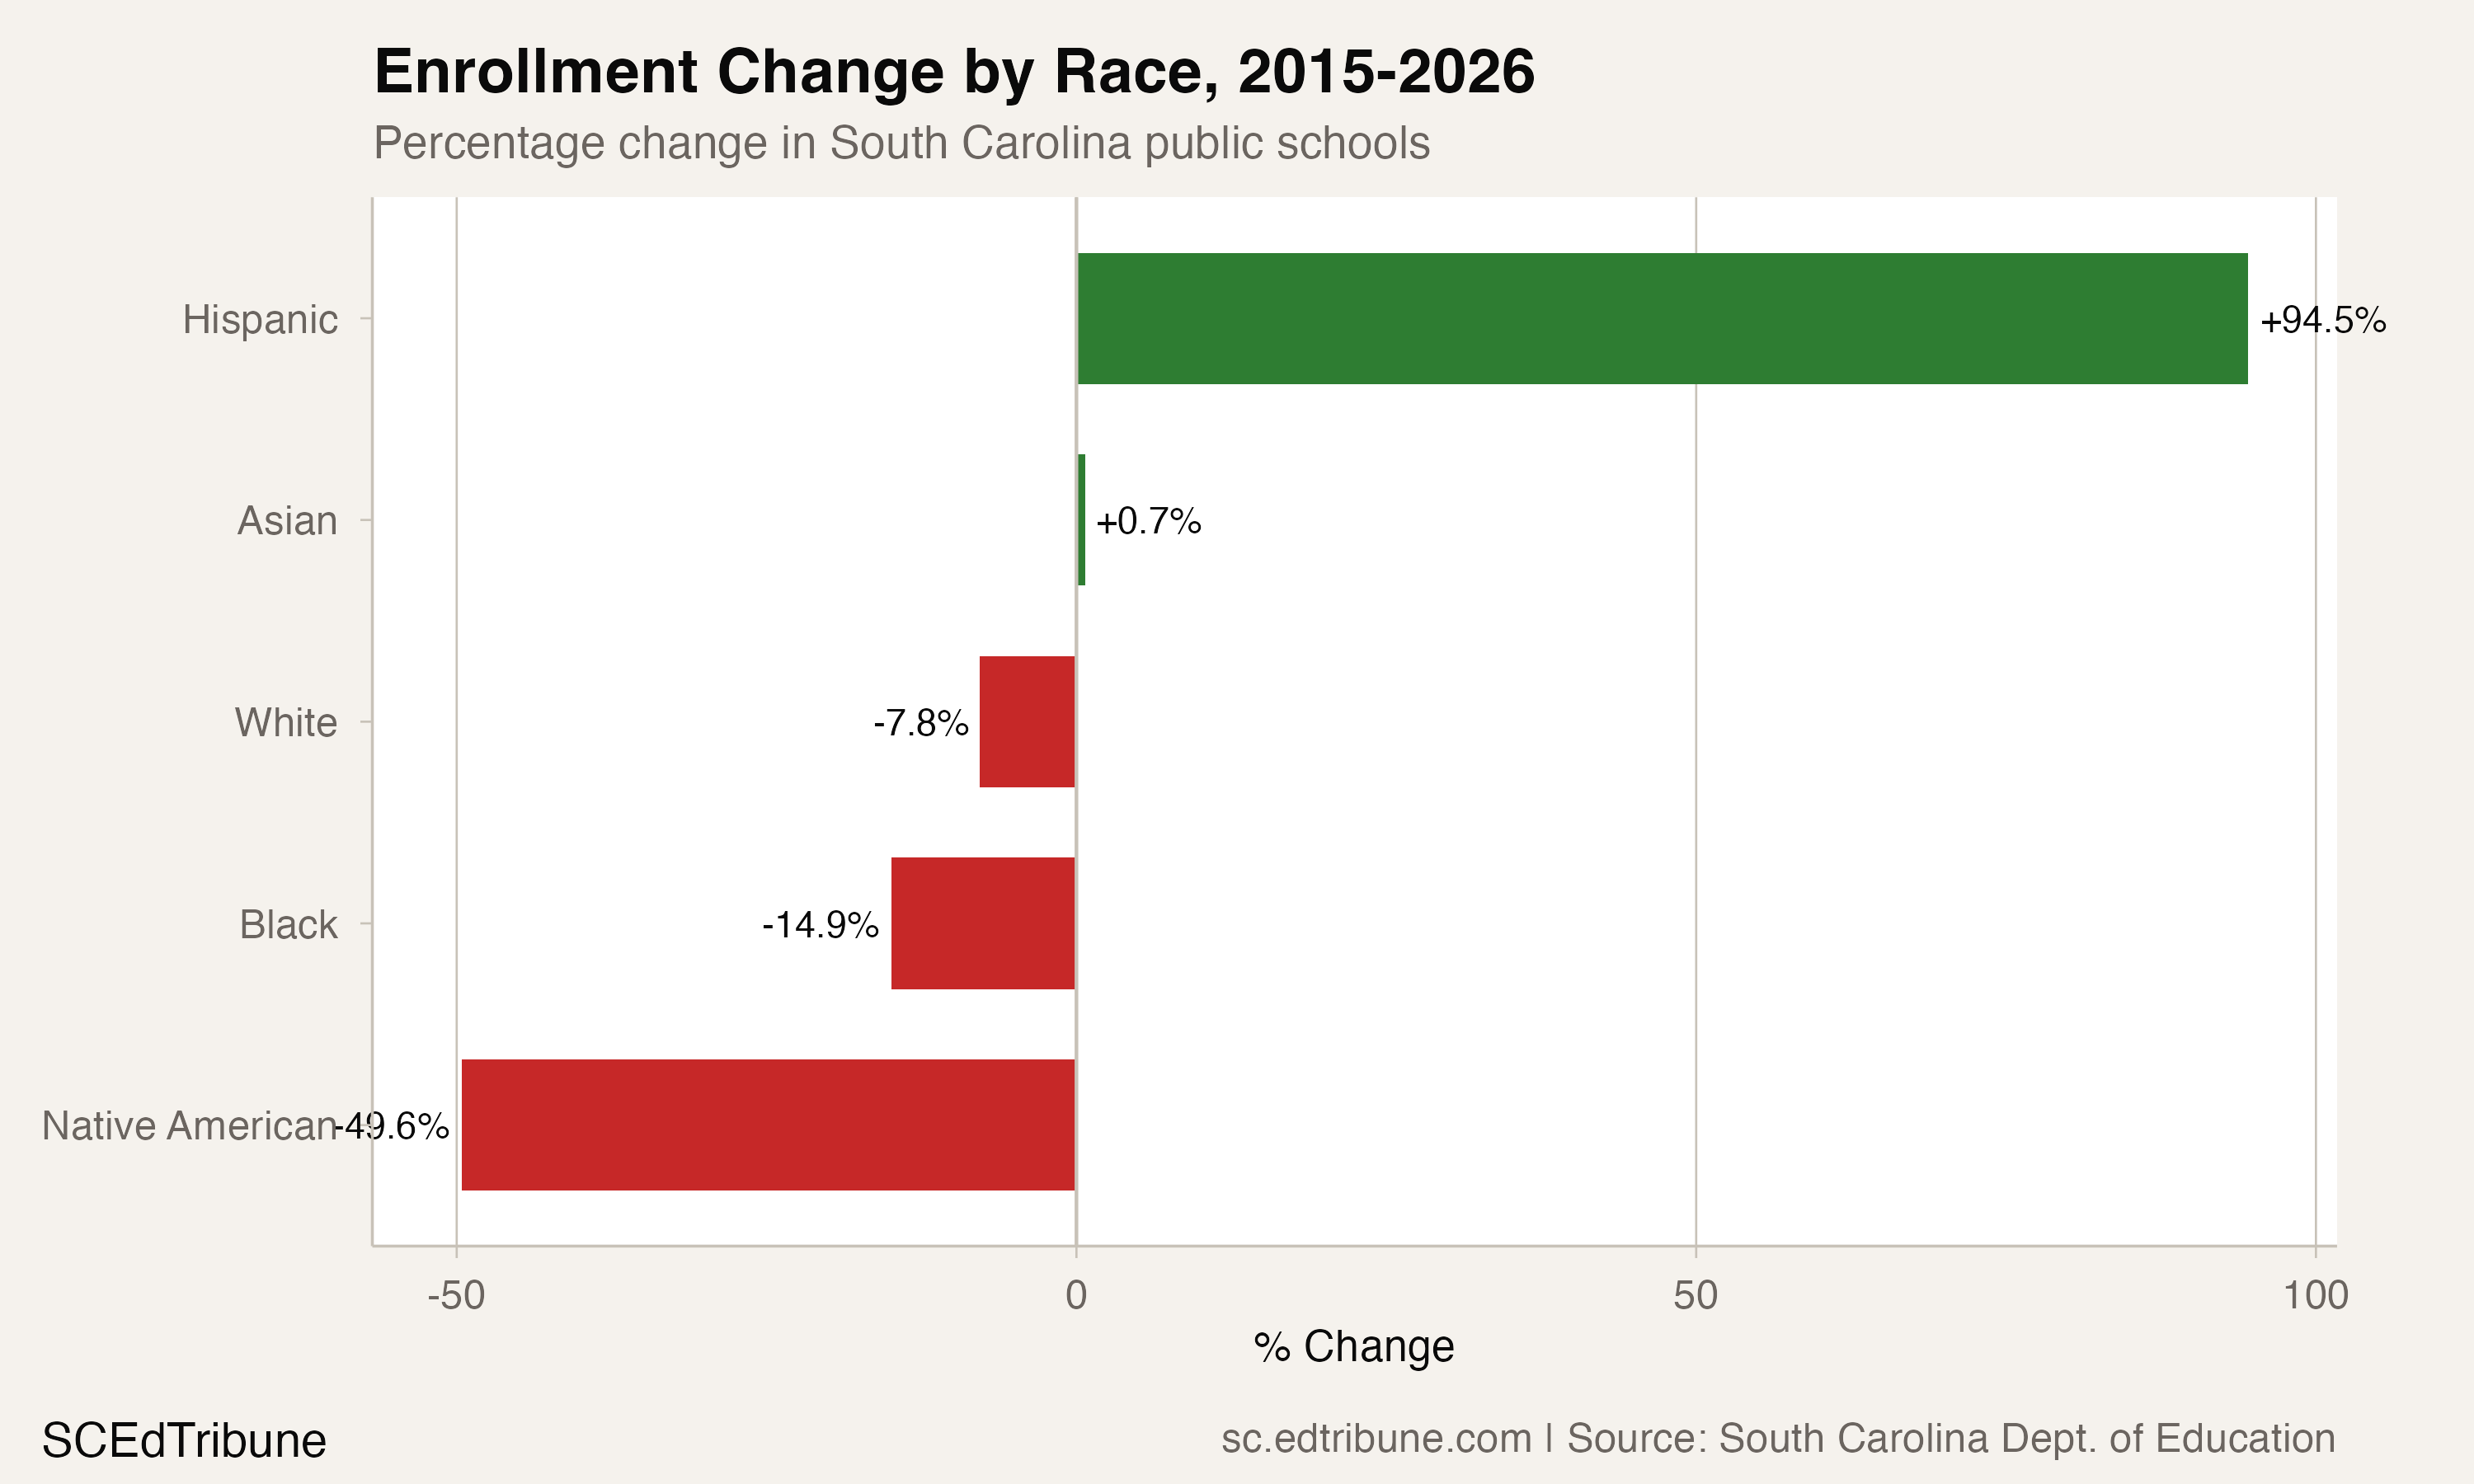
South Carolina's public schools enrolled 4,450 students who are Native American in the 2015-16 school year. By 2025-26, that number had fallen to 2,244, a loss of 49.6%. No other racial group in the state comes close to that rate of decline. Black enrollment fell 14.9% over the same period. White enrollment dropped 7.8%. Hispanic enrollment nearly doubled.
But that 49.6% figure is misleading. Nearly all of the decline happened in a single year, and it traces to a change in how the state classifies students rather than to students leaving.
The 2017 cliff
Between 2016 and 2017, Native American enrollment in South Carolina dropped from 4,494 to 2,429, a loss of 2,065 students, or 46%, in 12 months. That same year, South Carolina began reporting multiracial as a separate racial category in its enrollment data. The multiracial category debuted at 29,119 students in 2017 and has since grown to 50,431, a 73.2% increase.
The pattern is consistent with what federal researchers have documented nationally. Students previously counted as Native American, particularly those with one Native American parent and one parent of another race, were reclassified into the new multiracial category. The decline was not a mass exodus from public schools. It was a change in how the state counted its students.
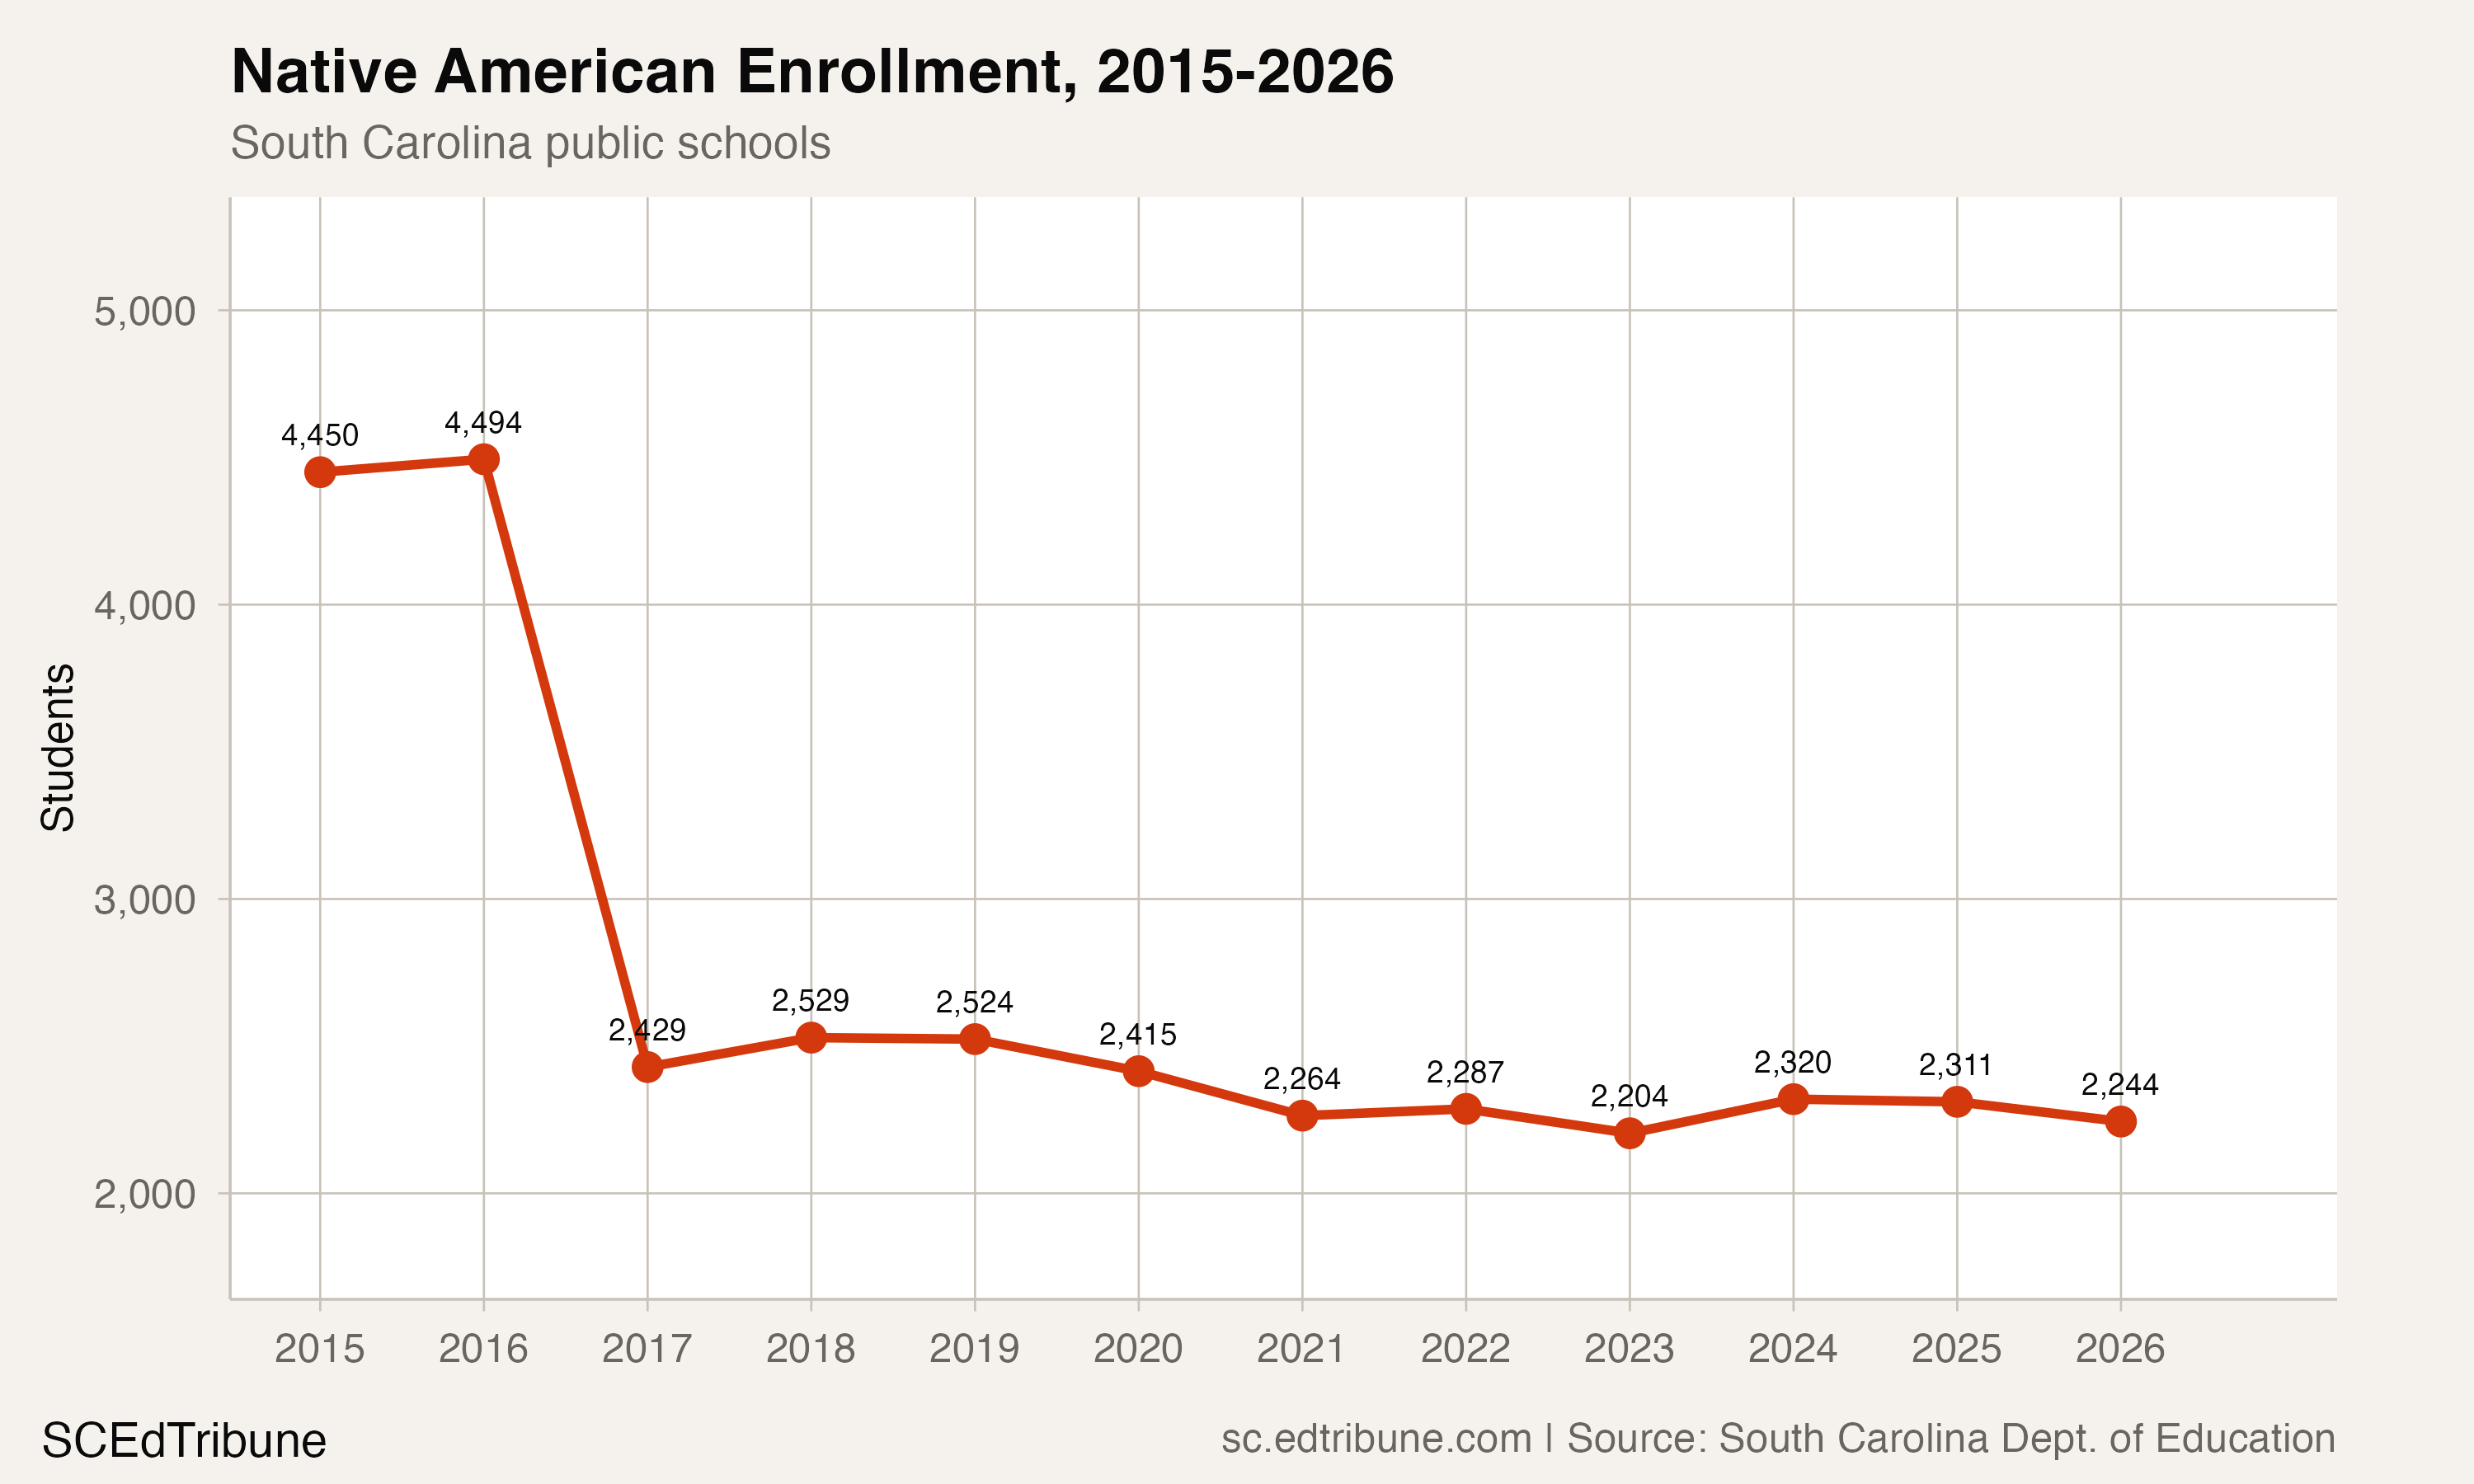
The trend chart makes the reclassification visible: a plateau at roughly 4,450 through 2016, a vertical drop to 2,429 in 2017, and then a relatively flat line through 2026. The students did not leave. They were recategorized.
What happened nationally
South Carolina's experience mirrors a national pattern. Between the 2010 and 2020 censuses, individuals identifying as both Native American and another race grew by 160%, according to Brookings Institution analysis. In K-12 data, this shift has been even more pronounced. The National Indian Education Association reports approximately 459,000 AI/AN students in the K-12 system nationally, comprising 1% of all public school students, down from 534,000 a decade earlier.
Princeton researchers Soumya Pao and Douglas Starr found that Census Bureau algorithms were actively recoding individuals who specified a Native tribal origin under white or Black categories as multiracial, "even if that does not align with the respondent's stated racial self-identification." The school data equivalent is the federal reporting standard change: when districts began offering a multiracial checkbox, families that had previously selected "American Indian/Alaska Native" as their sole category now selected multiple boxes. The reporting system then classified those students as multiracial.
"As many as one in 20 undergraduate students identify as American Indian or Alaska Native alone or in combination, five times higher than those identifying exclusively as Native American." -- Brookings Institution, 2025
The gap between "alone" and "alone or in combination" counts is the statistical footprint of reclassification. South Carolina's 2017 data break is the K-12 version of the same phenomenon.
The real decline underneath
Strip away the 2017 reclassification, and a more modest but still real decline emerges. From 2017 to 2026, Native American enrollment fell from 2,429 to 2,244, a loss of 185 students, or 7.6%, over nine years. That pace of decline is slower than the state's Black enrollment loss over the same period and roughly comparable to the national AI/AN trend.
Seven of the 11 year-over-year transitions since 2015 have been negative. The four upticks, the largest in 2018 (+100) and 2024 (+116), were each followed by renewed declines. No sustained recovery has taken hold.
Native American students now represent 0.28% of South Carolina's total enrollment, down from 0.59% in 2015. Even adjusting for the reclassification break, their share has fallen: from 0.31% in 2017 to 0.28% in 2026, a state where total enrollment grew 2.2% over that period.
Two lines diverging
The relationship between Native American and multiracial enrollment is the clearest evidence of reclassification at work. Indexed to 2017 as a baseline, the two groups trace mirror-image trajectories. Multiracial enrollment has grown 73.2% while Native American enrollment has declined 7.6%.
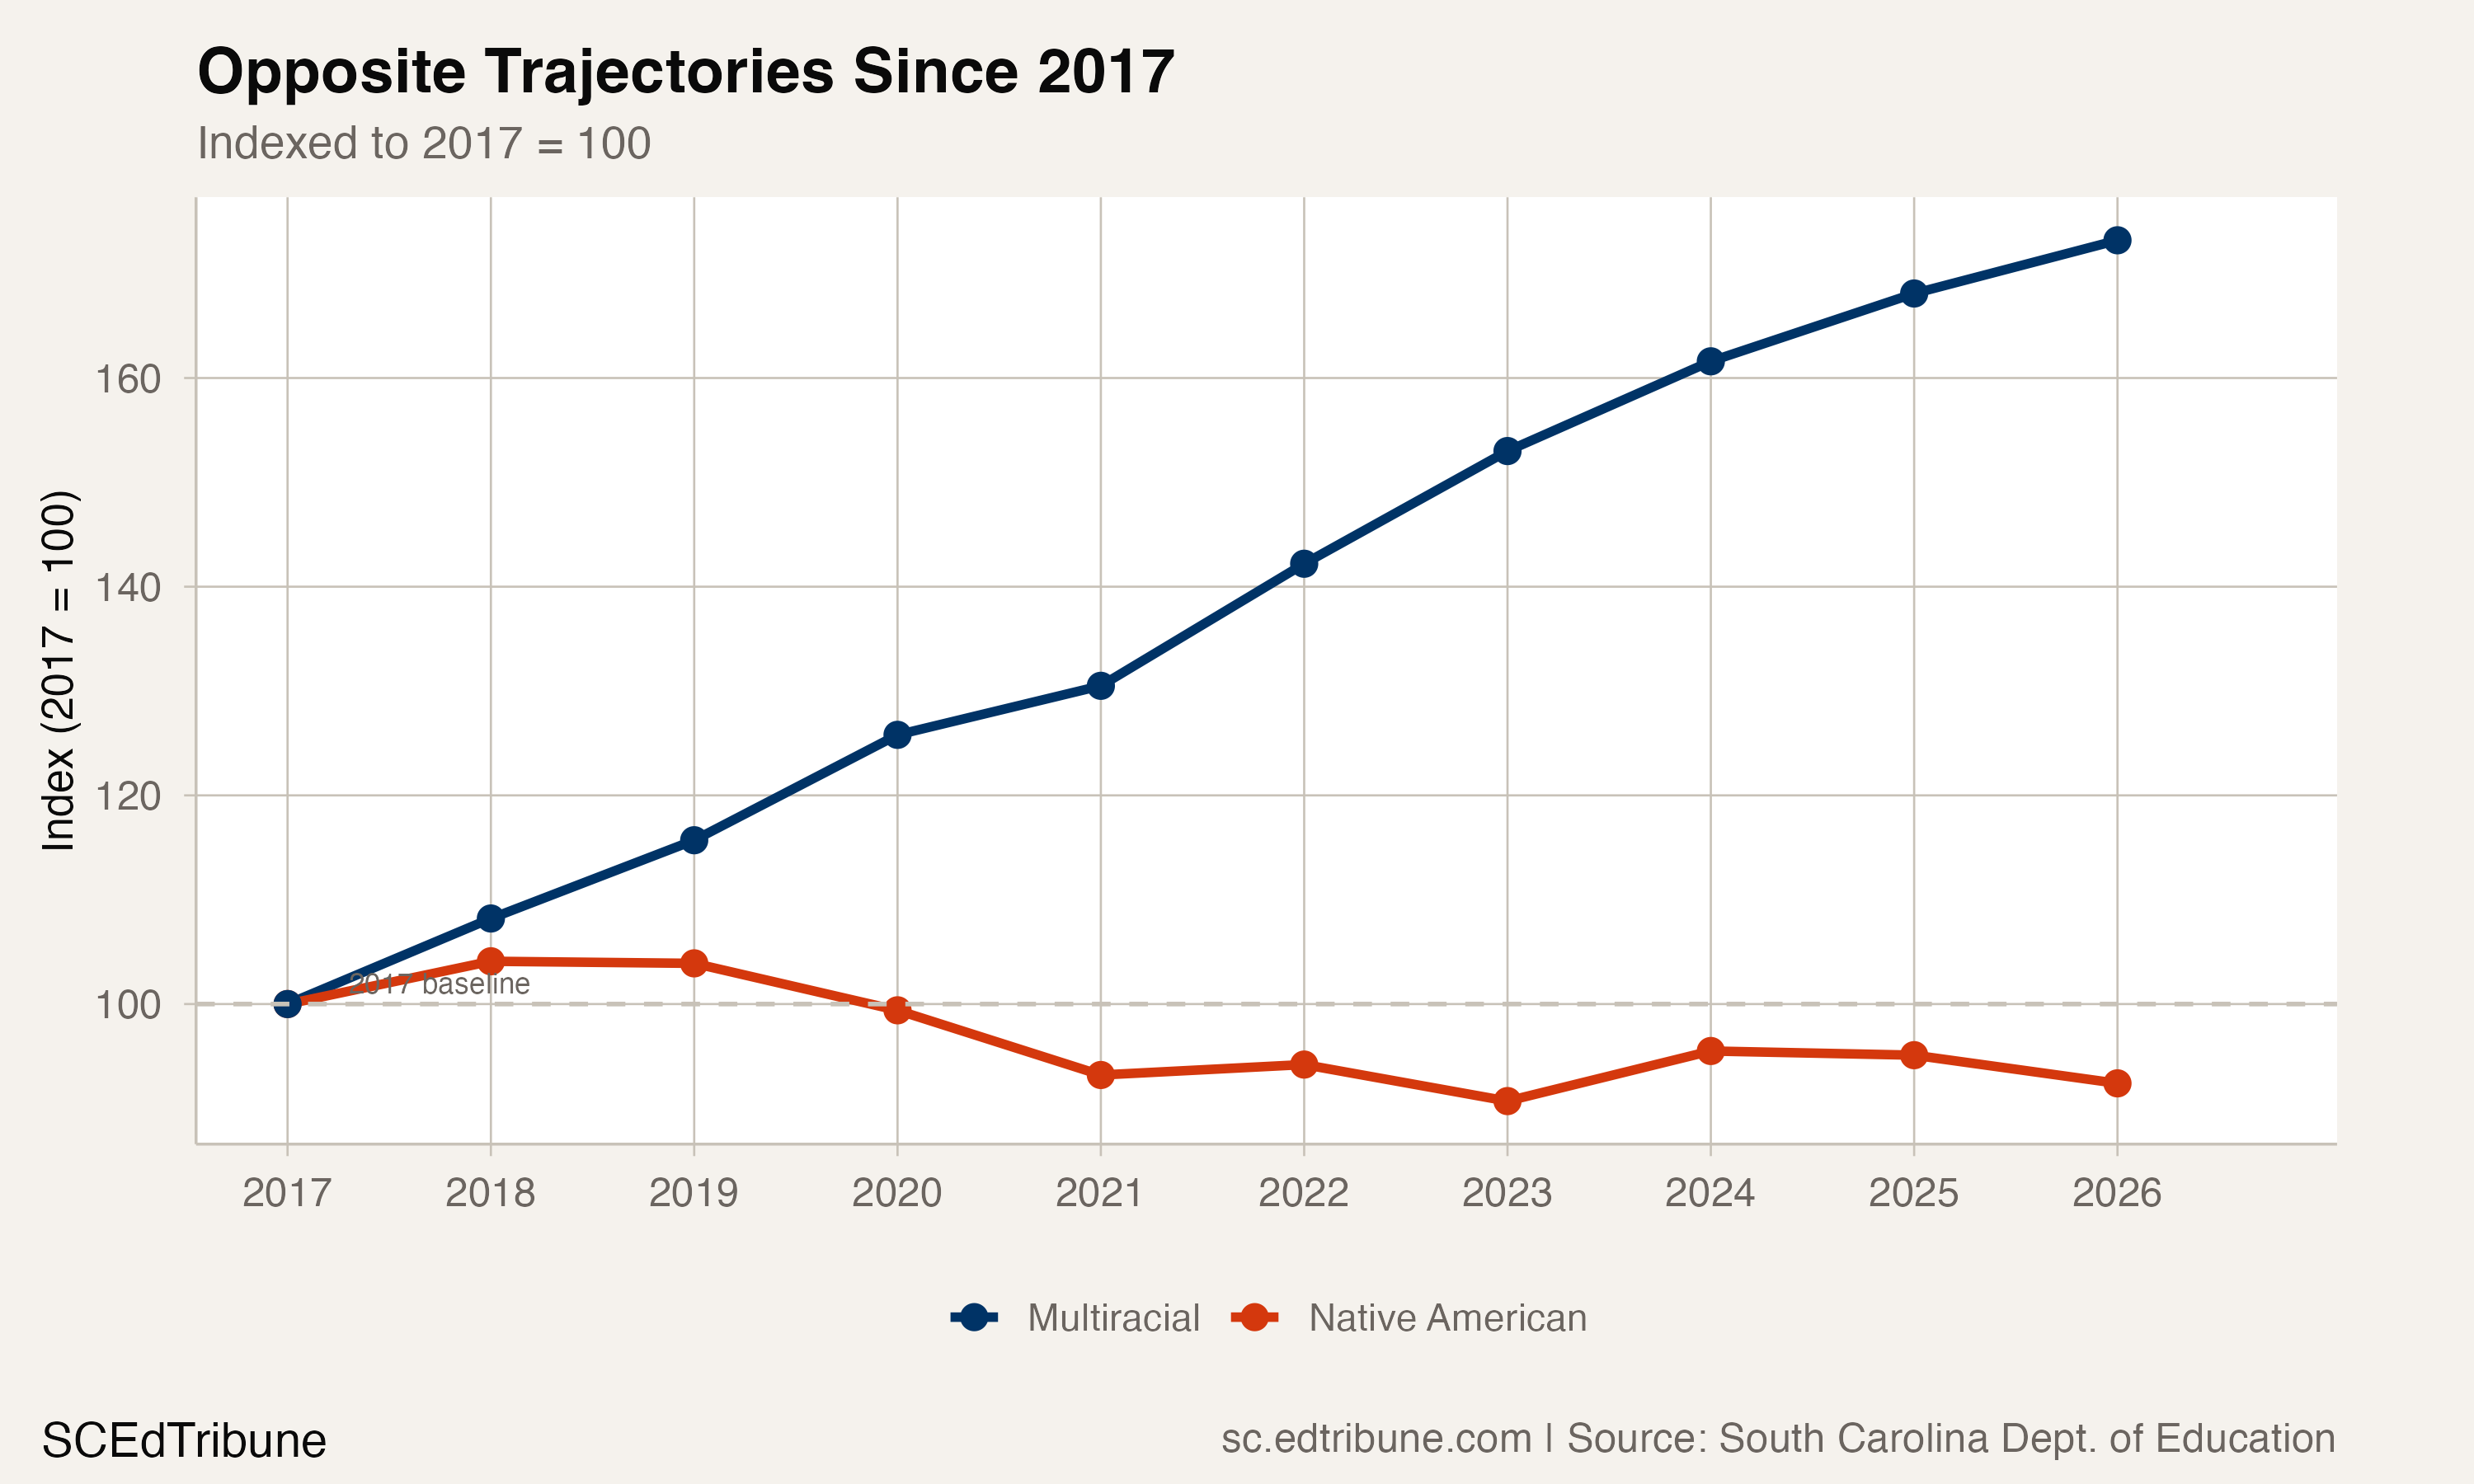
The divergence is not one-to-one; multiracial growth draws from students previously classified across multiple racial categories, not just Native American. But the timing and direction are consistent. South Carolina added roughly 21,300 multiracial students between 2017 and 2026 while losing 185 Native American students. The multiracial category absorbed students from across the racial spectrum, but the impact was proportionally largest on the smallest group. Losing even a fraction of 4,450 students to reclassification cuts deeper than losing the same fraction of 391,000 white students.
Where the losses concentrate
Nearly every district with 20 or more Native American students in 2015 lost ground by 2026; only two grew. The losses were not concentrated in any particular region. Dorchester 02↗ET lost 80.5% of its Native American enrollment, falling from 210 to 41. Charleston 01↗ET fell 74.7%, from 150 to 38. Beaufort 01↗ET dropped 81.8%, from 110 to 20.
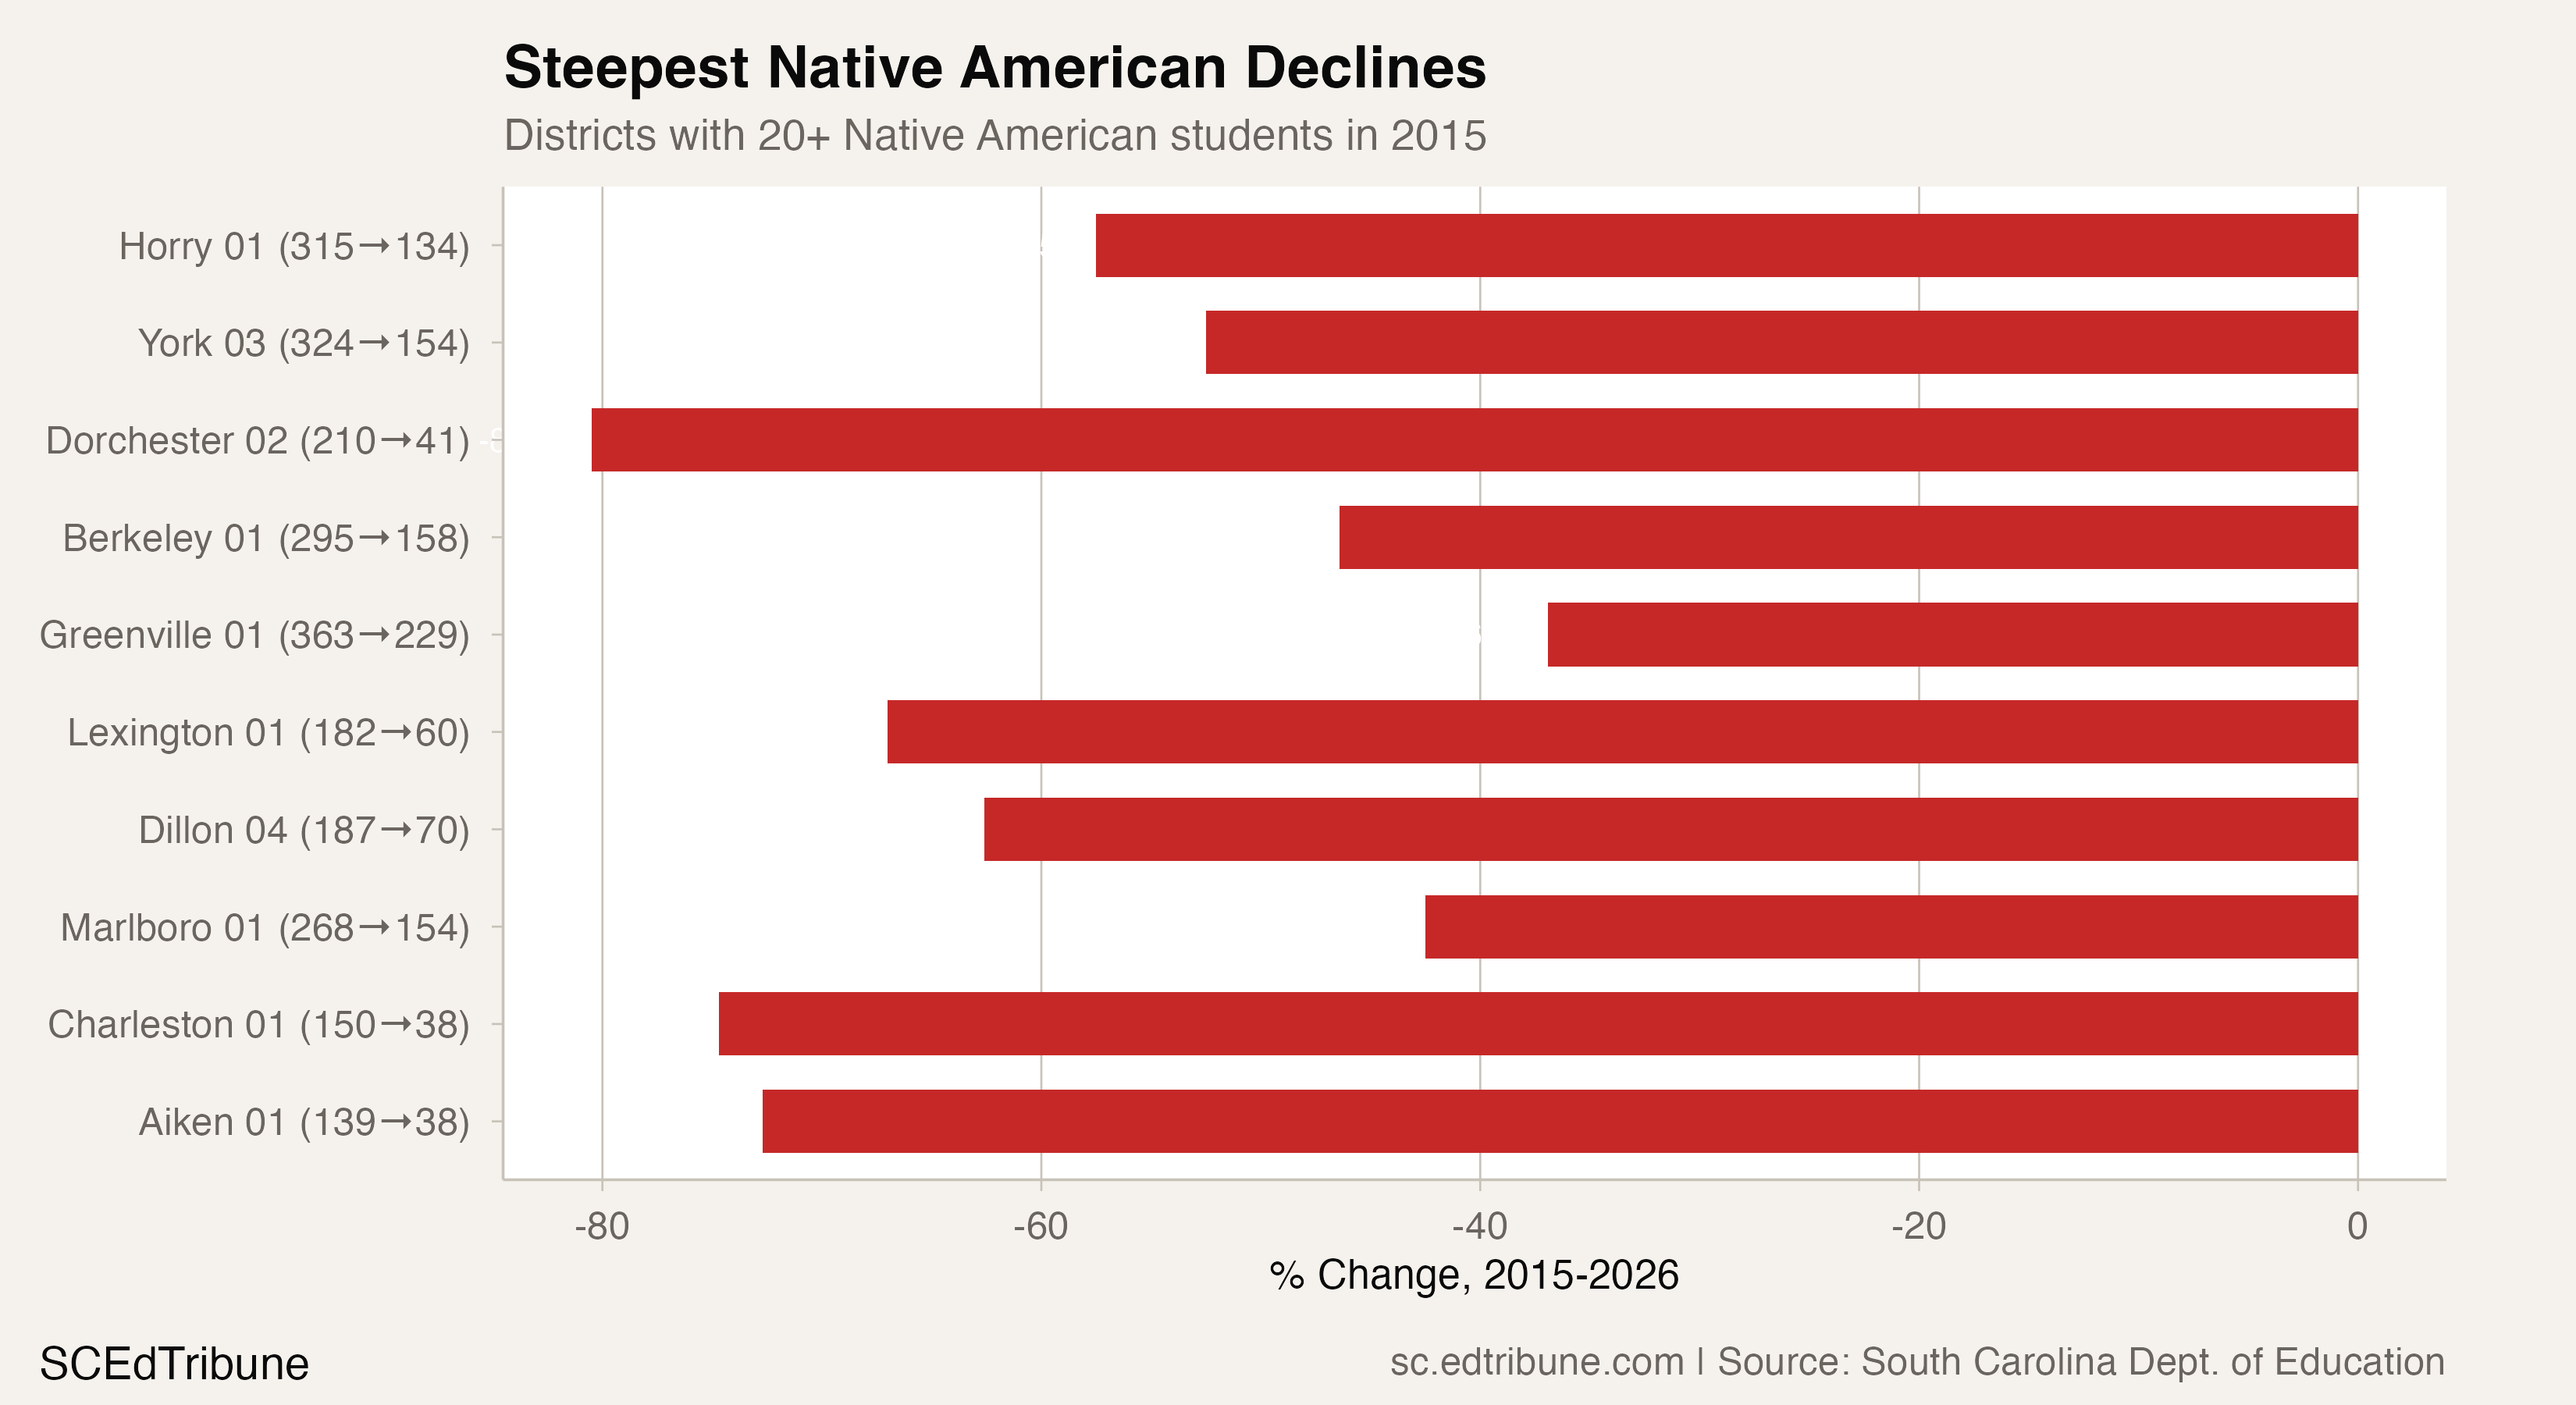
The largest absolute losses came from the state's biggest districts. Horry 01↗ET lost 181 Native American students (-57.5%), York 03↗ET lost 170 (-52.5%), and Greenville 01↗ET lost 134 (-36.9%). These are suburban and exurban growth districts. Their total enrollment grew over this period. Their Native American numbers fell.
One notable exception: Spartanburg 02↗ET gained 48 Native American students, growing from 69 to 117, a 69.6% increase. The district is one of only two with 20 or more Native American students in 2015 that showed growth.
The geographic breadth of the decline, hitting coastal, Piedmont, and Pee Dee districts alike, reinforces the reclassification explanation. A demographic shift driven by migration or tribal school alternatives would be concentrated in specific communities. A reporting change would produce uniform declines everywhere, which is what the data shows.
South Carolina's tribal context
South Carolina is home to the Catawba Nation, the only federally recognized tribe in the state, based near Rock Hill in York County. The Pee Dee Indian Tribe, with roughly 150 enrolled members in Marlboro County, holds state recognition. Several other groups have varying levels of state recognition, including the Edisto Natchez-Kusso, Santee Indian Nation, and Wassamasaw Tribe of Varnertown Indians.
None of these tribes operates K-12 schools. Catawba Nation runs an early childhood program for birth through age five, but school-age children attend public schools in York County districts. The absence of tribal school alternatives means these students are not leaving the public system for a parallel education network, unlike in states with Bureau of Indian Education schools or tribal contract schools.
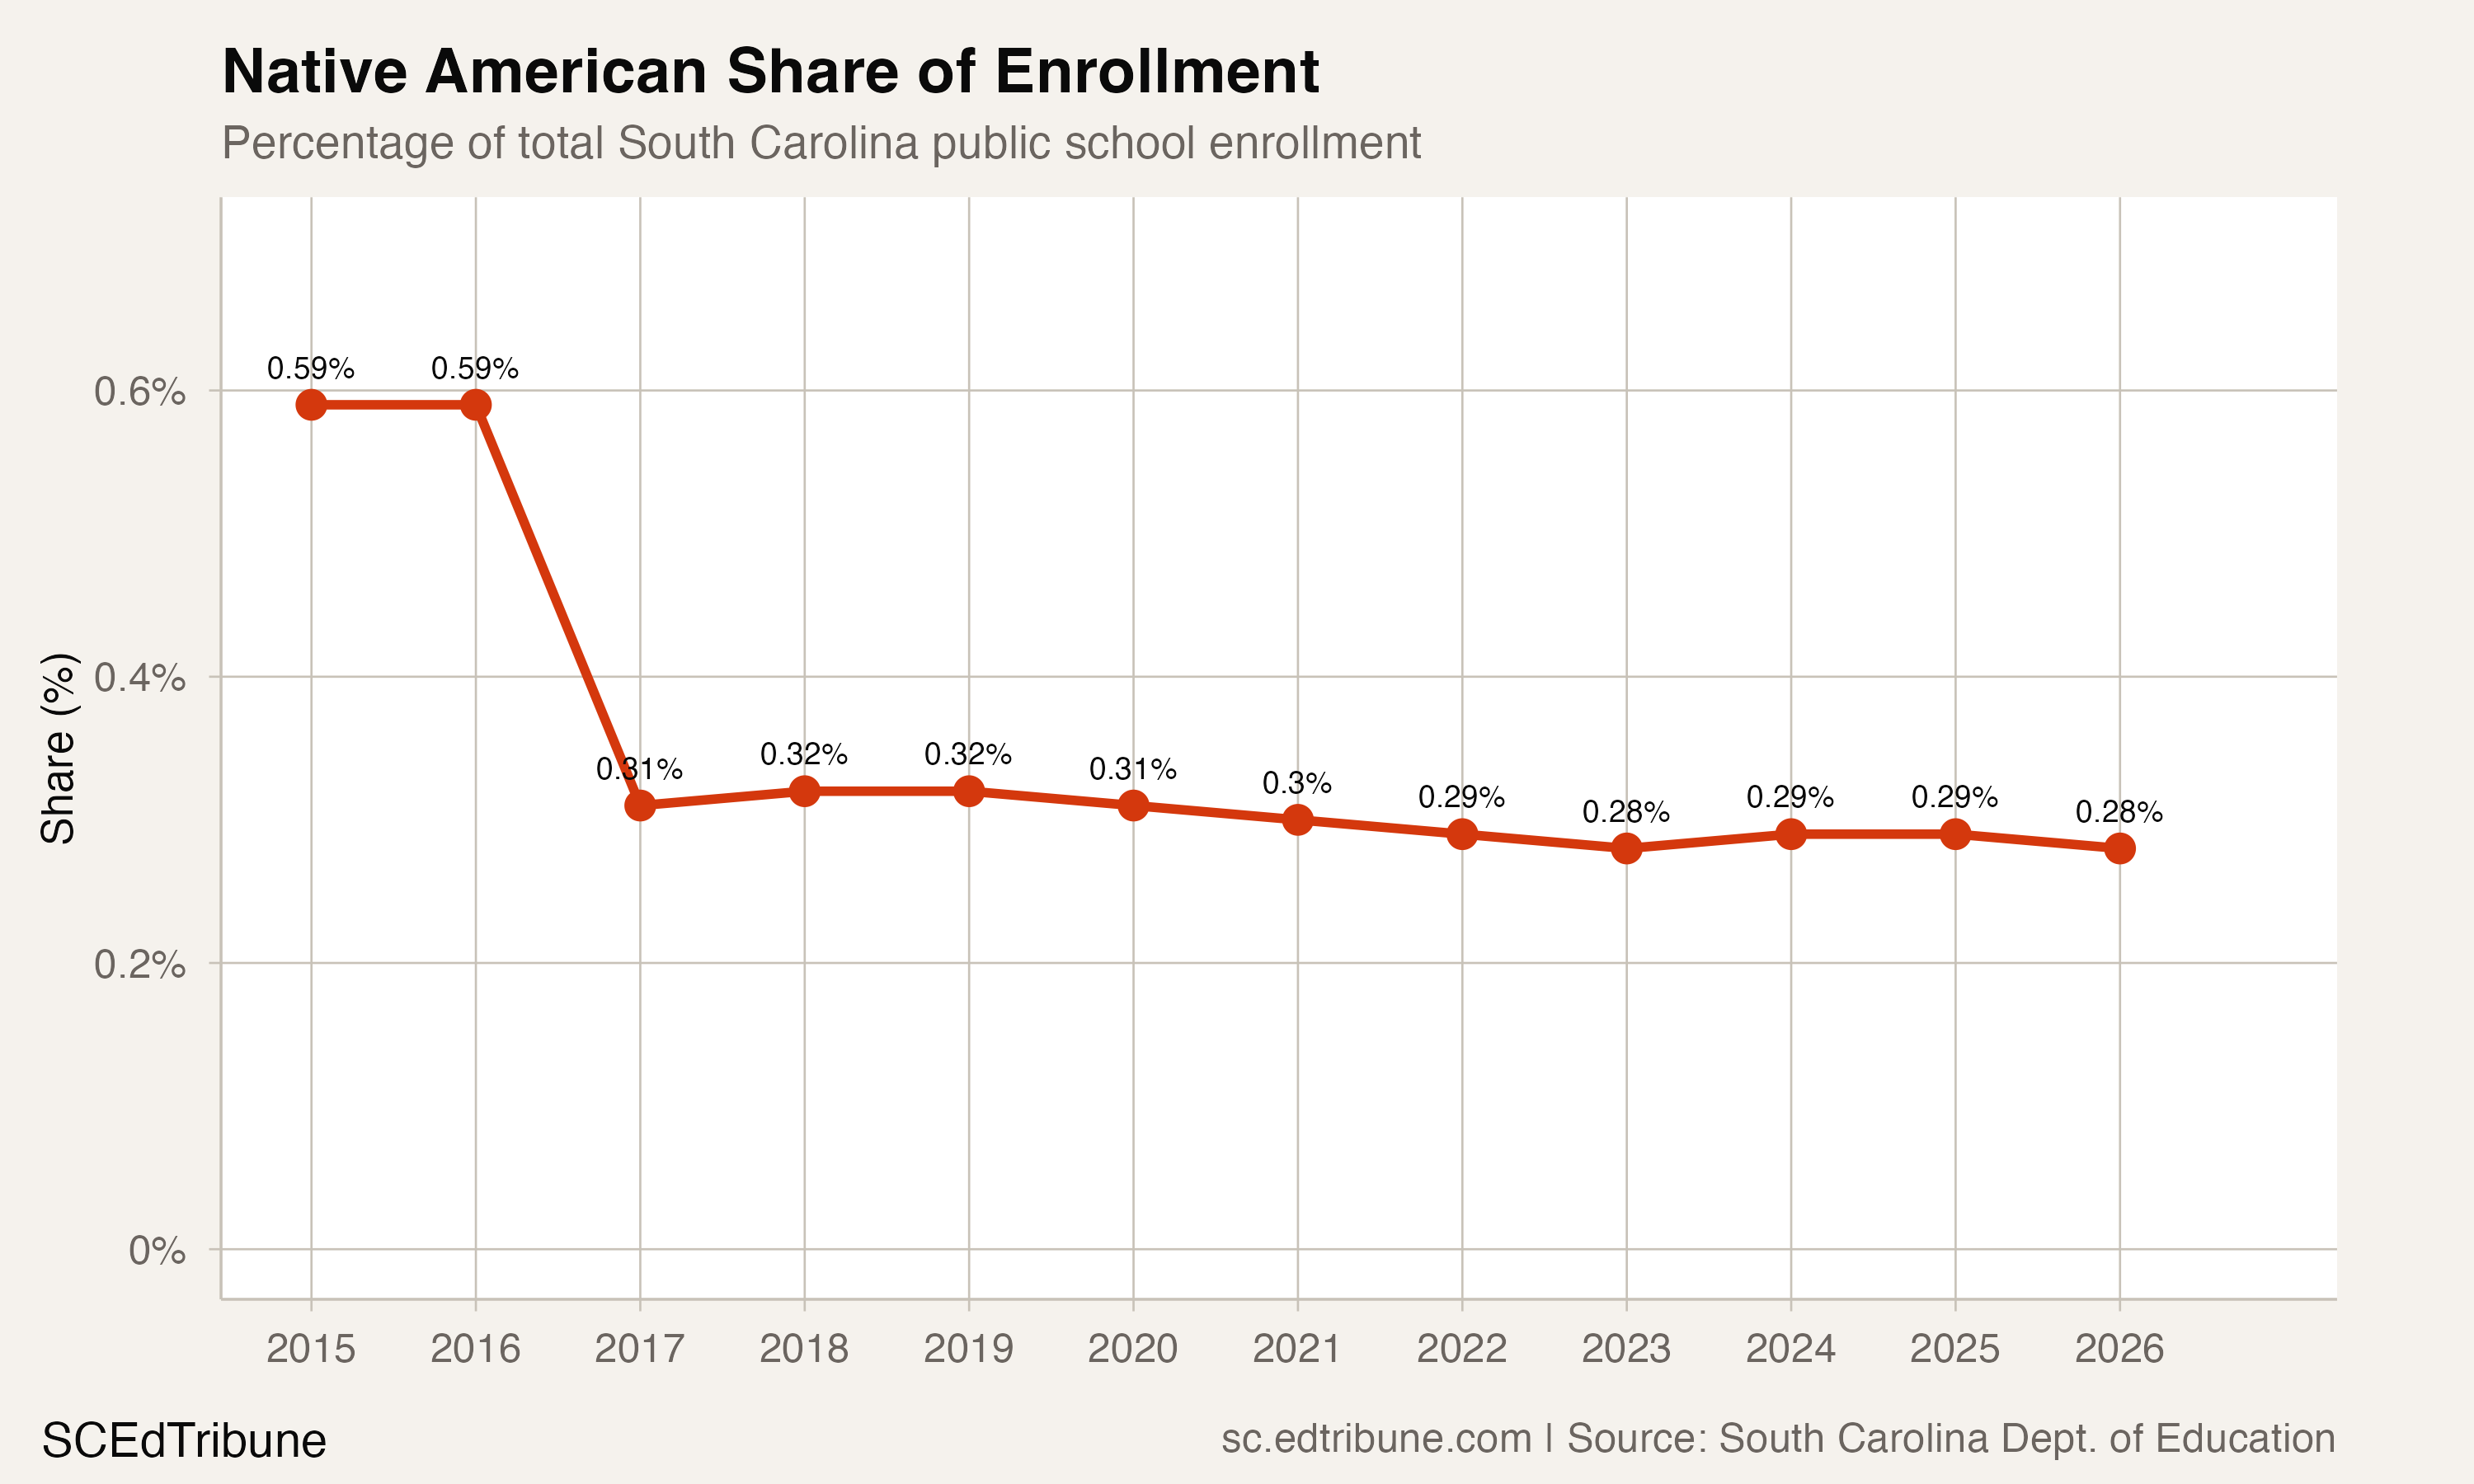
The share chart tells the reclassification story succinctly: a step-function drop from 0.59% to 0.31% in 2017, followed by a slow erosion to 0.28% by 2026. The post-2017 decline in share is partly a numerator effect (fewer Native American students) and partly a denominator effect (total state enrollment grew 2.2% from 2017 to 2026).
What the data cannot answer
This analysis cannot distinguish between reclassification and other factors at the individual student level. South Carolina's enrollment data reports what category each student is assigned to. It does not track whether a student counted as Native American in 2016 was counted as multiracial in 2017, or whether entirely different students now fill those categories.
The post-2017 decline of 185 students could reflect continued reclassification as new cohorts enter school with multiracial rather than Native American designations. It could also reflect real demographic change: smaller birth cohorts in Native American communities, families moving out of state, or enrollment in private or homeschool settings. The data cannot separate these mechanisms.
Federal reporting standards are under revision. New federal standards may allow "alone or in combination" reporting, which could recapture multiracial students with Native American heritage in AI/AN counts. Whether South Carolina adopts such an approach will determine whether the 2,244 figure is the floor, or whether the true Native American student population, by a broader definition, is several times larger.
The 2027-28 school year, the first under any revised federal standards, will be the test. If Native American counts jump back up without a corresponding drop in multiracial, the reclassification hypothesis will be confirmed. If they hold steady, the decline is real.
Detailed code that reproduces the analysis and figures in this article is available exclusively to EdTribune subscribers.
Discussion
Sign in to join the discussion.
Loading comments...