Correction (August 1, 2026): A July 20 correction to this article changed the count of districts at a ten-year graduation high from 27 to 26. The original 27 was correct, and it has been restored. Two distinct districts both report under the name "Governor's Schools," and both reached 100% in 2025; the analysis behind the July 20 change grouped districts by name rather than by their state identifier and merged the pair into one. The other July 20 corrections stand. Darlington did not bottom in 2022 and recover; it reached 92.7% that year before falling to 83.5% in 2025. The corrected Lexington 2 cumulative counterfactual is approximately 532 additional graduates across 2016 to 2025.
South Carolina's graduation rate reached 86.7% in 2025, the highest in the state's 2016-2025 series. Twenty-seven districts posted their highest rate in that ten-year window. The state produced 54,980 graduates, also the series high.
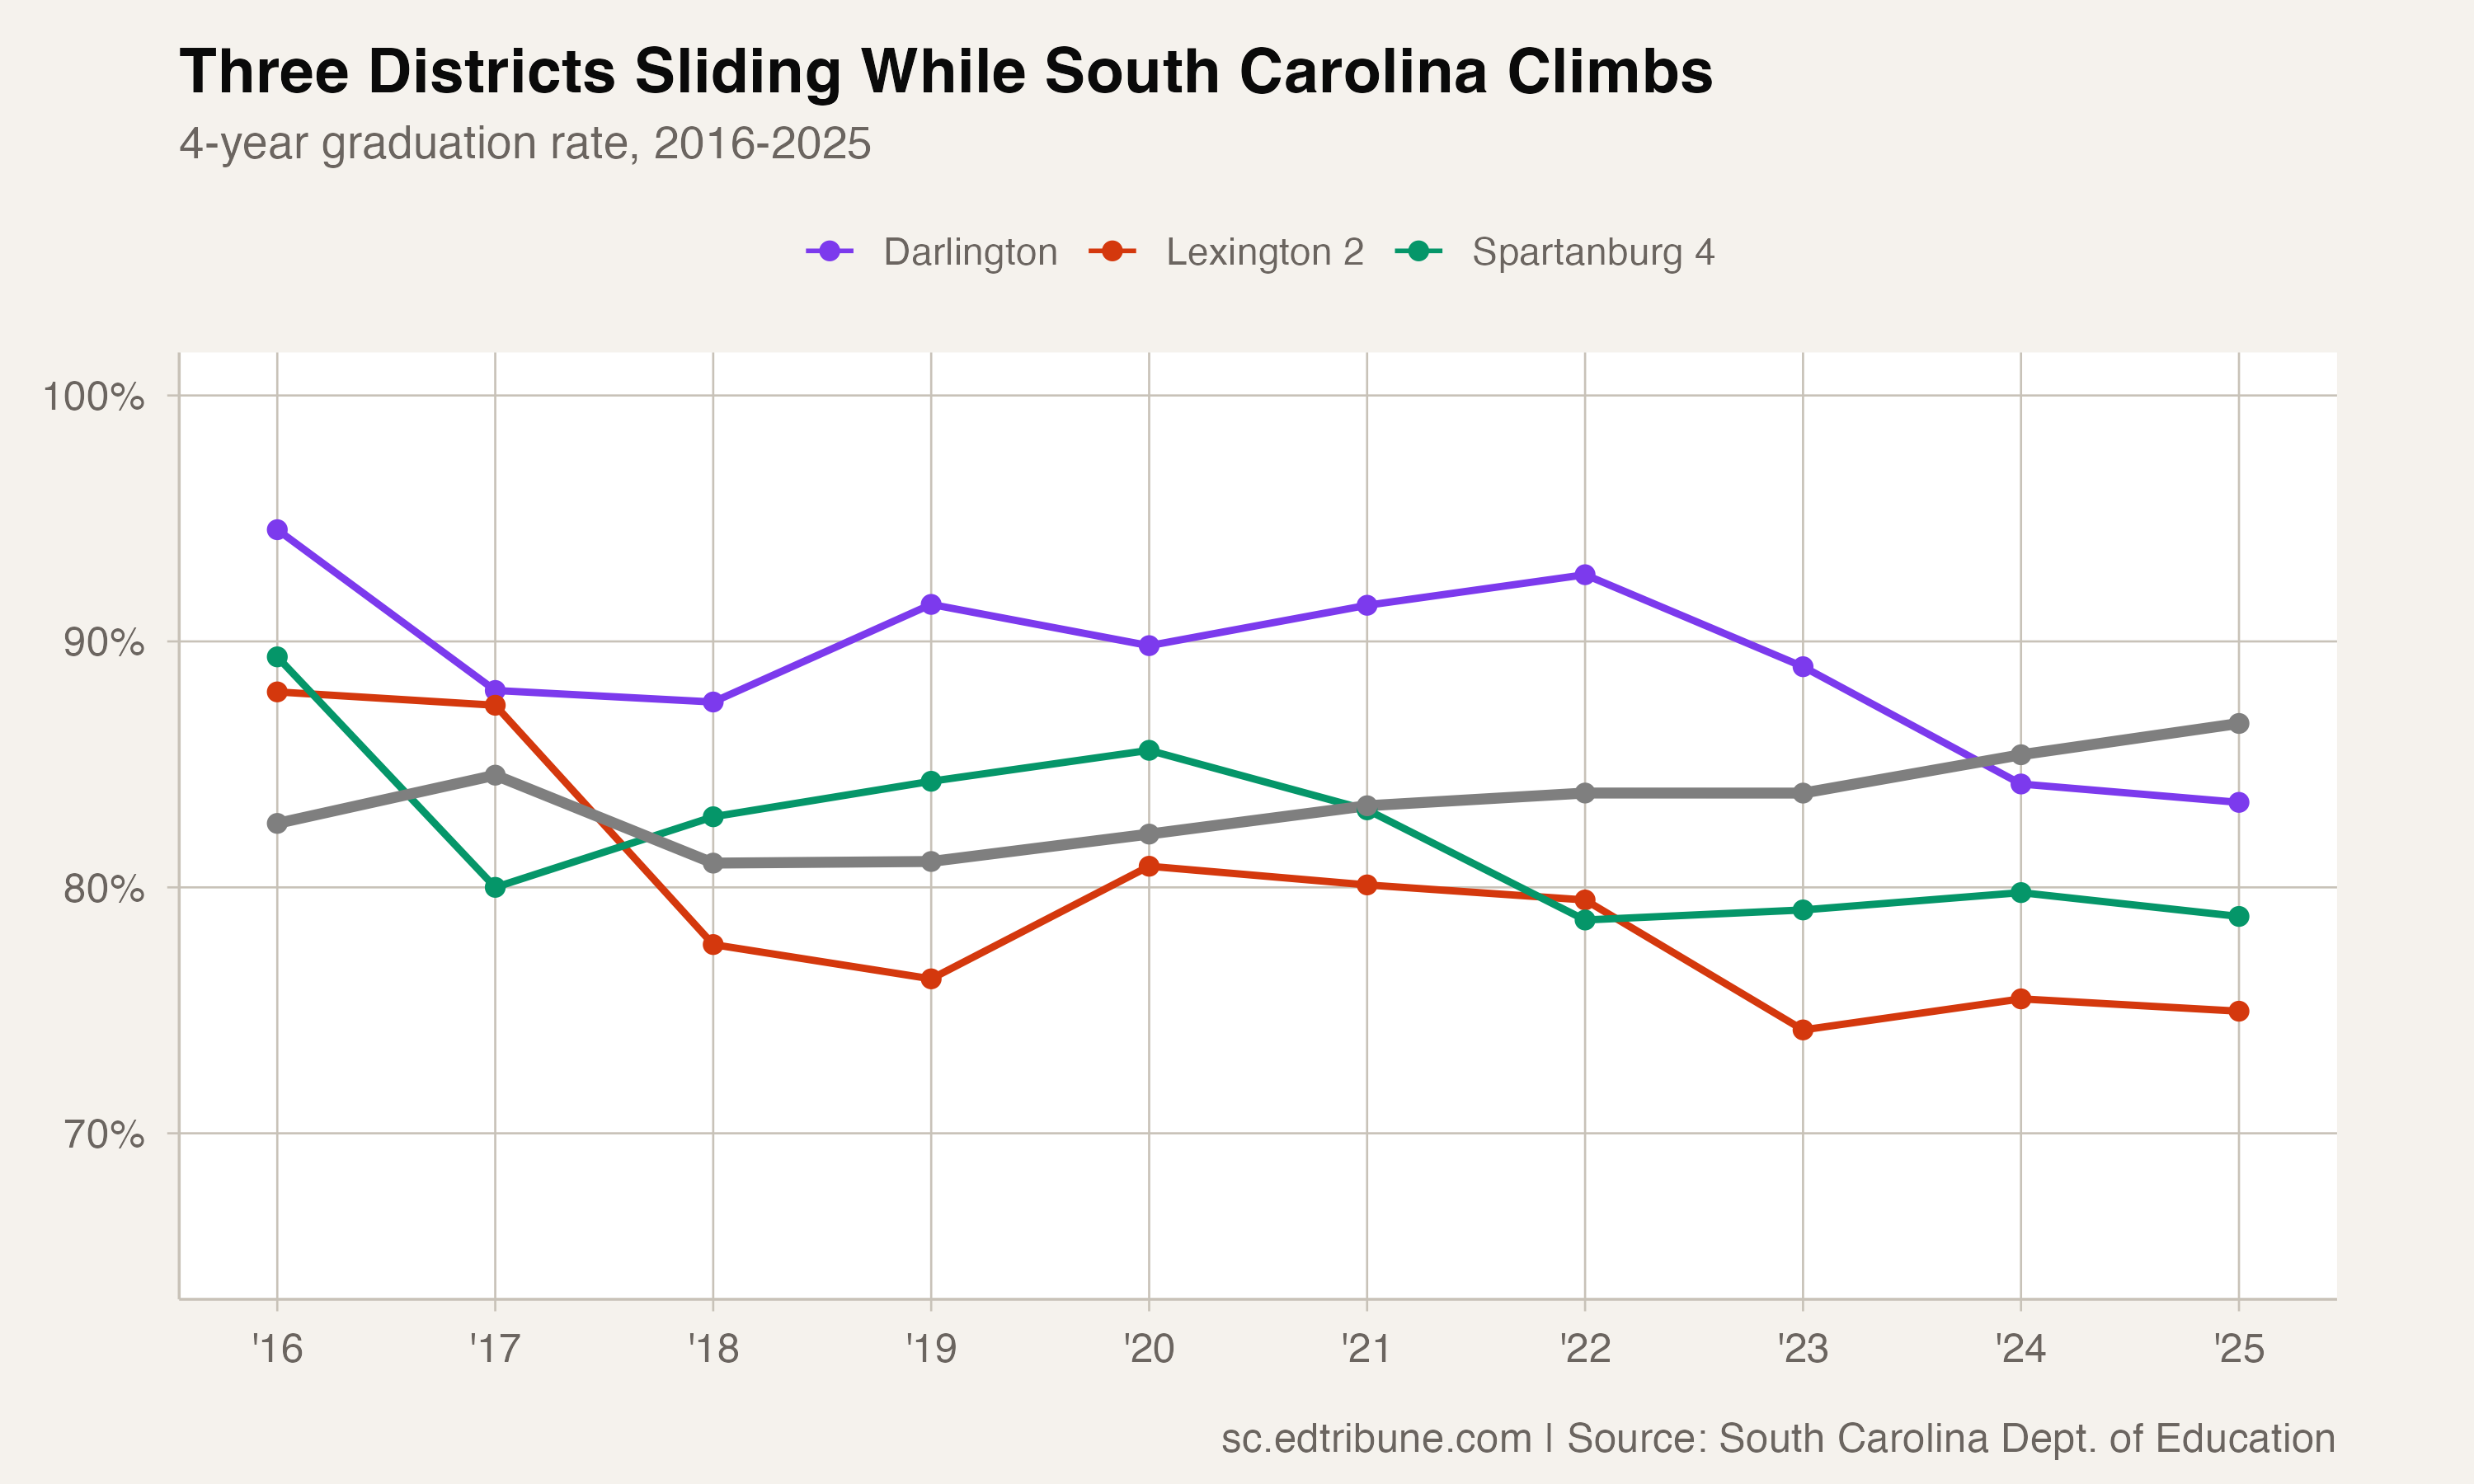
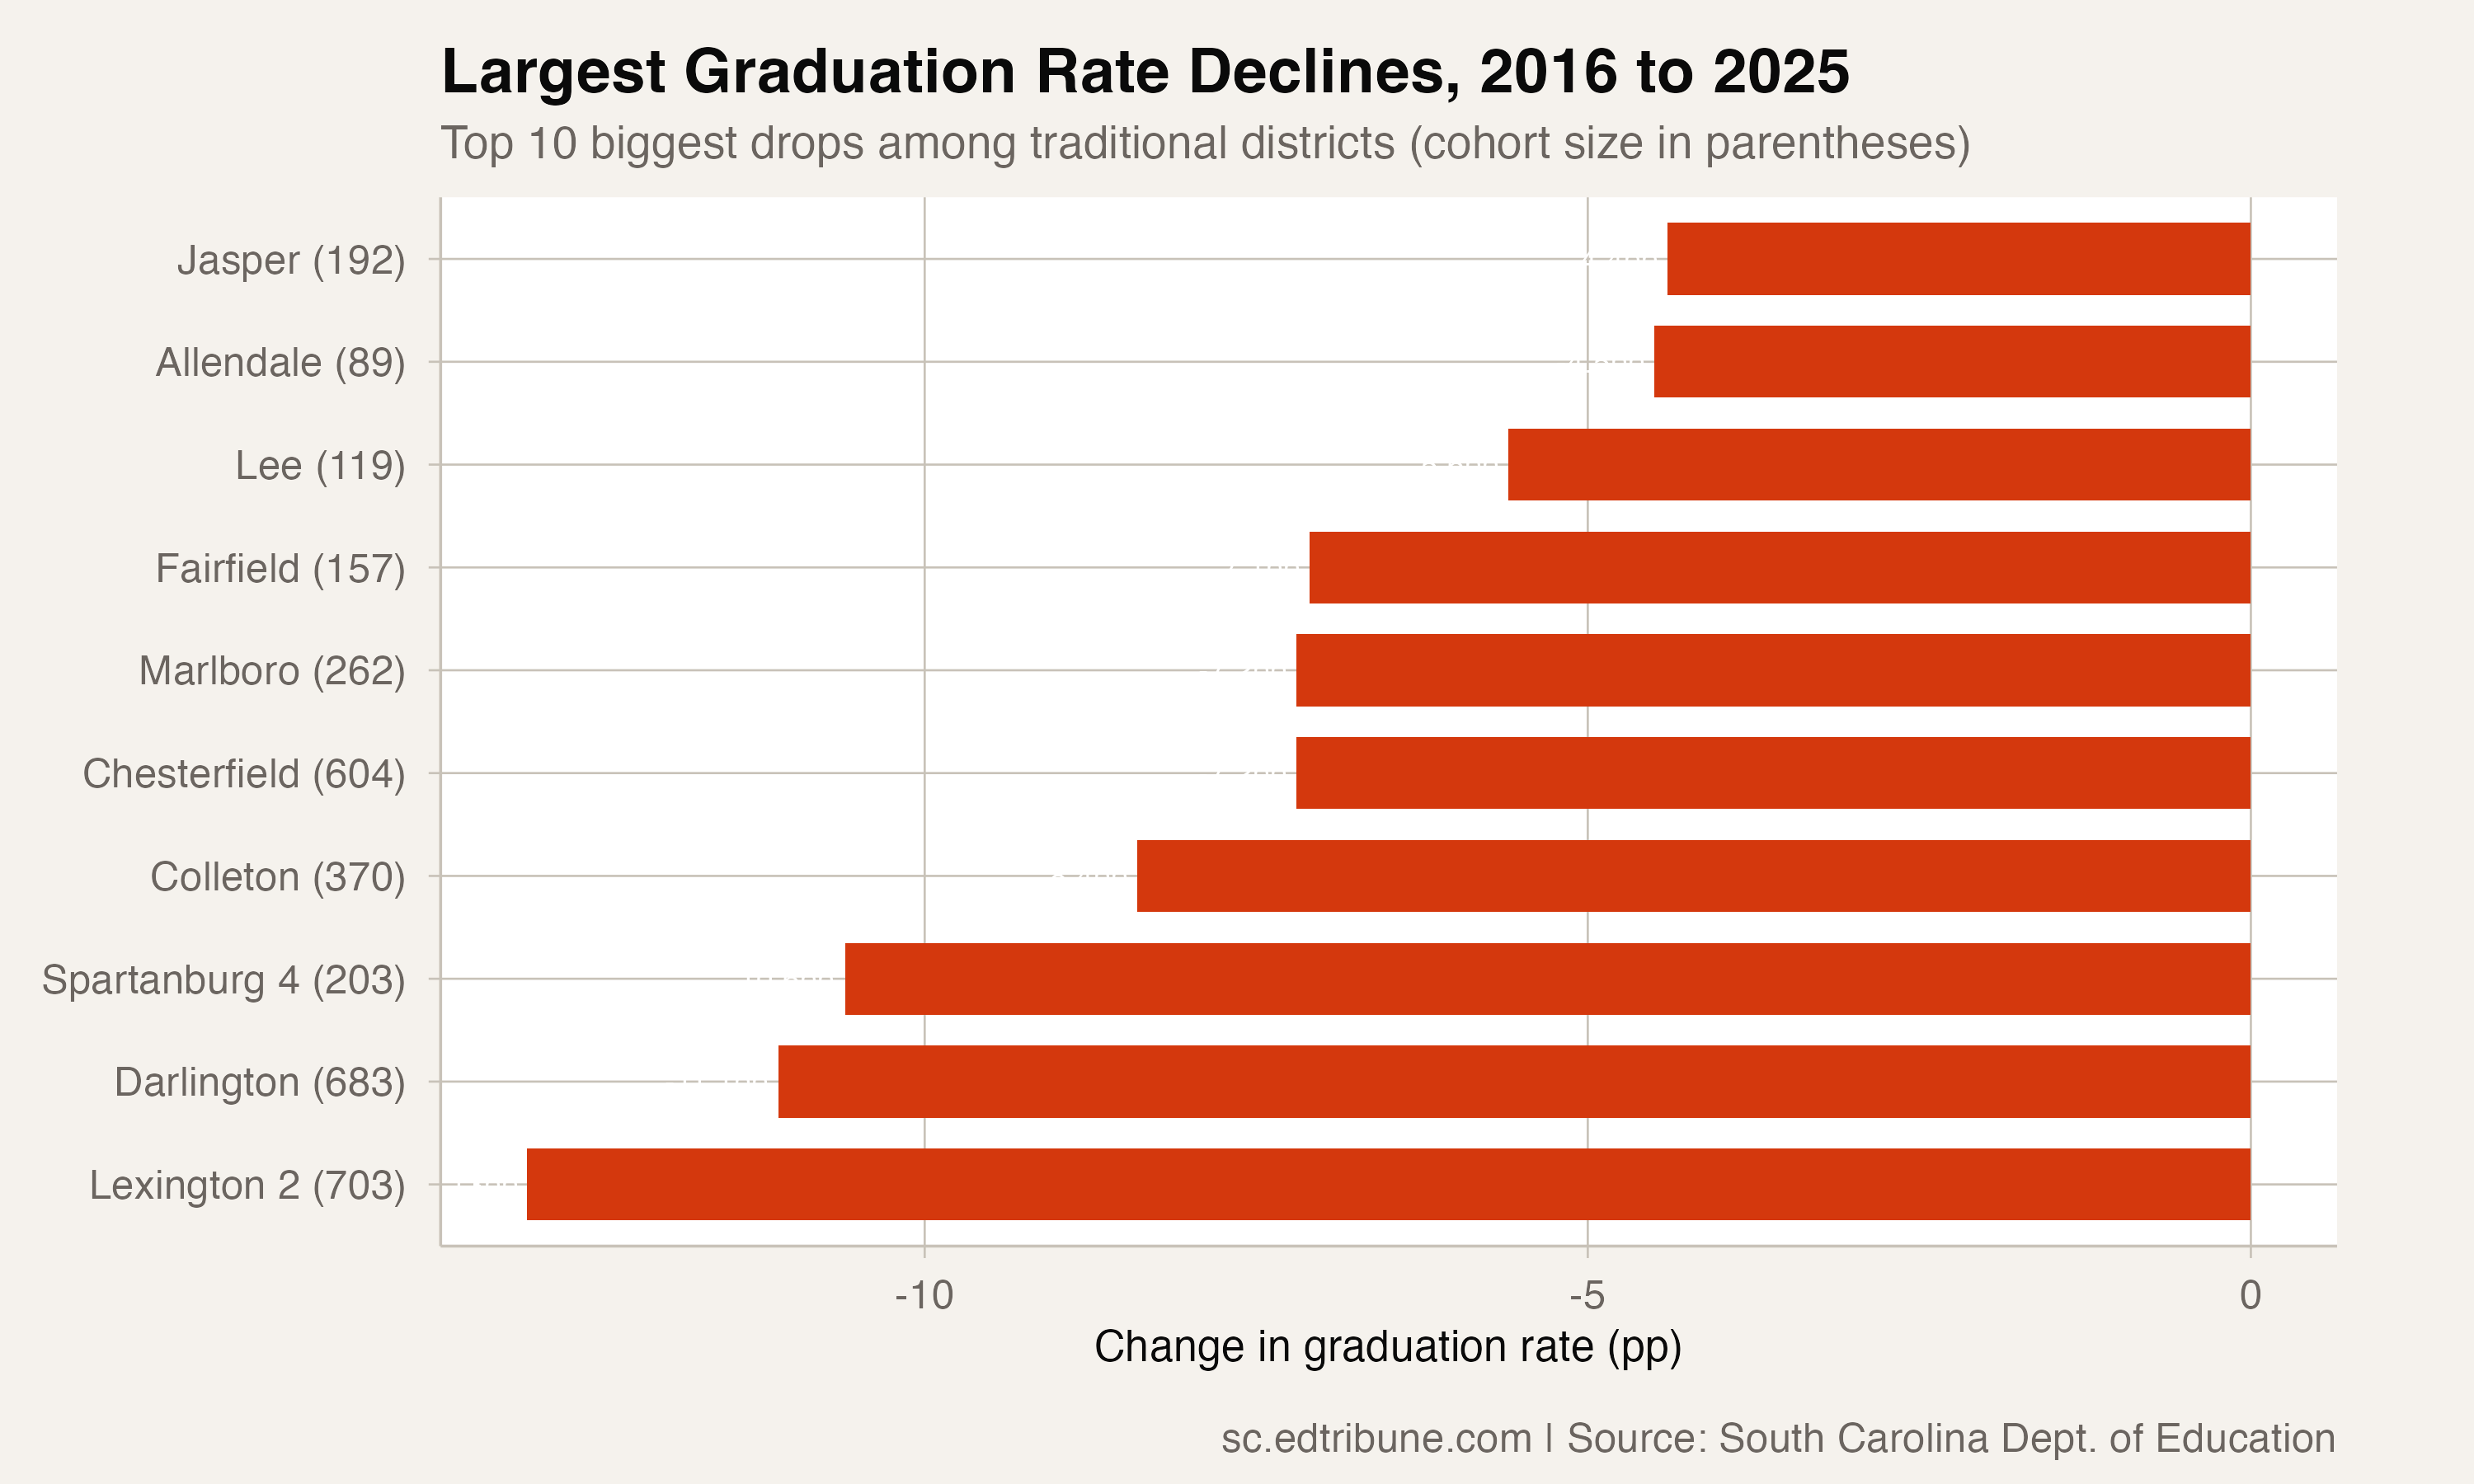
But not every district is riding that wave. Lexington 2↗ET dropped from 87.9% in 2016 to 75.0% in 2025, a 12.9 percentage-point decline while the state improved by 4.1 points. Darlington↗ET fell from 94.5% to 83.5%, giving up 11.0 points from what was once one of the highest rates in the state. Spartanburg 4↗ET went from 89.4% to 78.8%, losing 10.6 points.
These are not tiny districts where a few students can swing the rate. Lexington 2's cohort is 703 students. Darlington's is 683. Relative to their 2016 rates, the three districts' 2025 declines correspond to about 188 fewer on-time graduates across their current cohorts.
Lexington 2: the steepest fall
Lexington 2's decline is the most dramatic. The district graduated 87.9% of its class of 2016, above the state average. By 2025, it had dropped to 75.0%, 11.7 points below the state average.
The decline was not a single cliff. The rate fell from 87.9% in 2016 to 77.7% in 2018, rebounded to 80.9% in 2020, then fell to 74.2% in 2023 before edging up to 75.0% in 2025. Male students graduated at 69.4% in 2025, compared with 81.6% for female students. That 12.2-point gap was the widest among districts with graduating cohorts of at least 500 students.
Darlington: from 94.5% to 83.5%
Darlington's story is the most puzzling. The district posted a 94.5% graduation rate in 2016, one of the highest in South Carolina. By 2025, it had lost 11.0 points, landing at 83.5%.
Darlington's rate fell to 87.5% in 2018, rebounded to 92.7% in 2022, then declined for three consecutive years: 89.0% in 2023, 84.2% in 2024, and 83.5% in 2025. The district remains 11.0 points below where it started, and the recent data shows continued decline rather than recovery.
A 683-student cohort makes each percentage point consequential. The aggregate graduation records establish the decline but do not identify its cause.
By the numbers: If Lexington 2 had maintained its 2016 graduation rate of 87.9% through 2025, approximately 91 more students would have graduated from this year's cohort of 703. Across the ten reported classes from 2016 through 2025, the cumulative difference is approximately 532 graduates.
The contrast that matters
What the three districts share is their movement relative to the state: all were above the state average in 2016 and below it in 2025. Their paths between those endpoints differ. From 2023 to 2025, Lexington 2 improved 0.8 points, Darlington fell 5.5 points, and Spartanburg 4 slipped 0.3 points.
The statewide improvement narrative (a ten-year rate high, 27 districts at their series highs, and the largest graduate count in the available data) is accurate. But it is an average. Beneath it, these three districts represent communities where the graduation pipeline produces fewer completers per cohort than it did in 2016, even as the state around them improves.
Detailed code that reproduces the analysis and figures in this article is available exclusively to EdTribune subscribers.
Discussion
Sign in to join the discussion.
Loading comments...