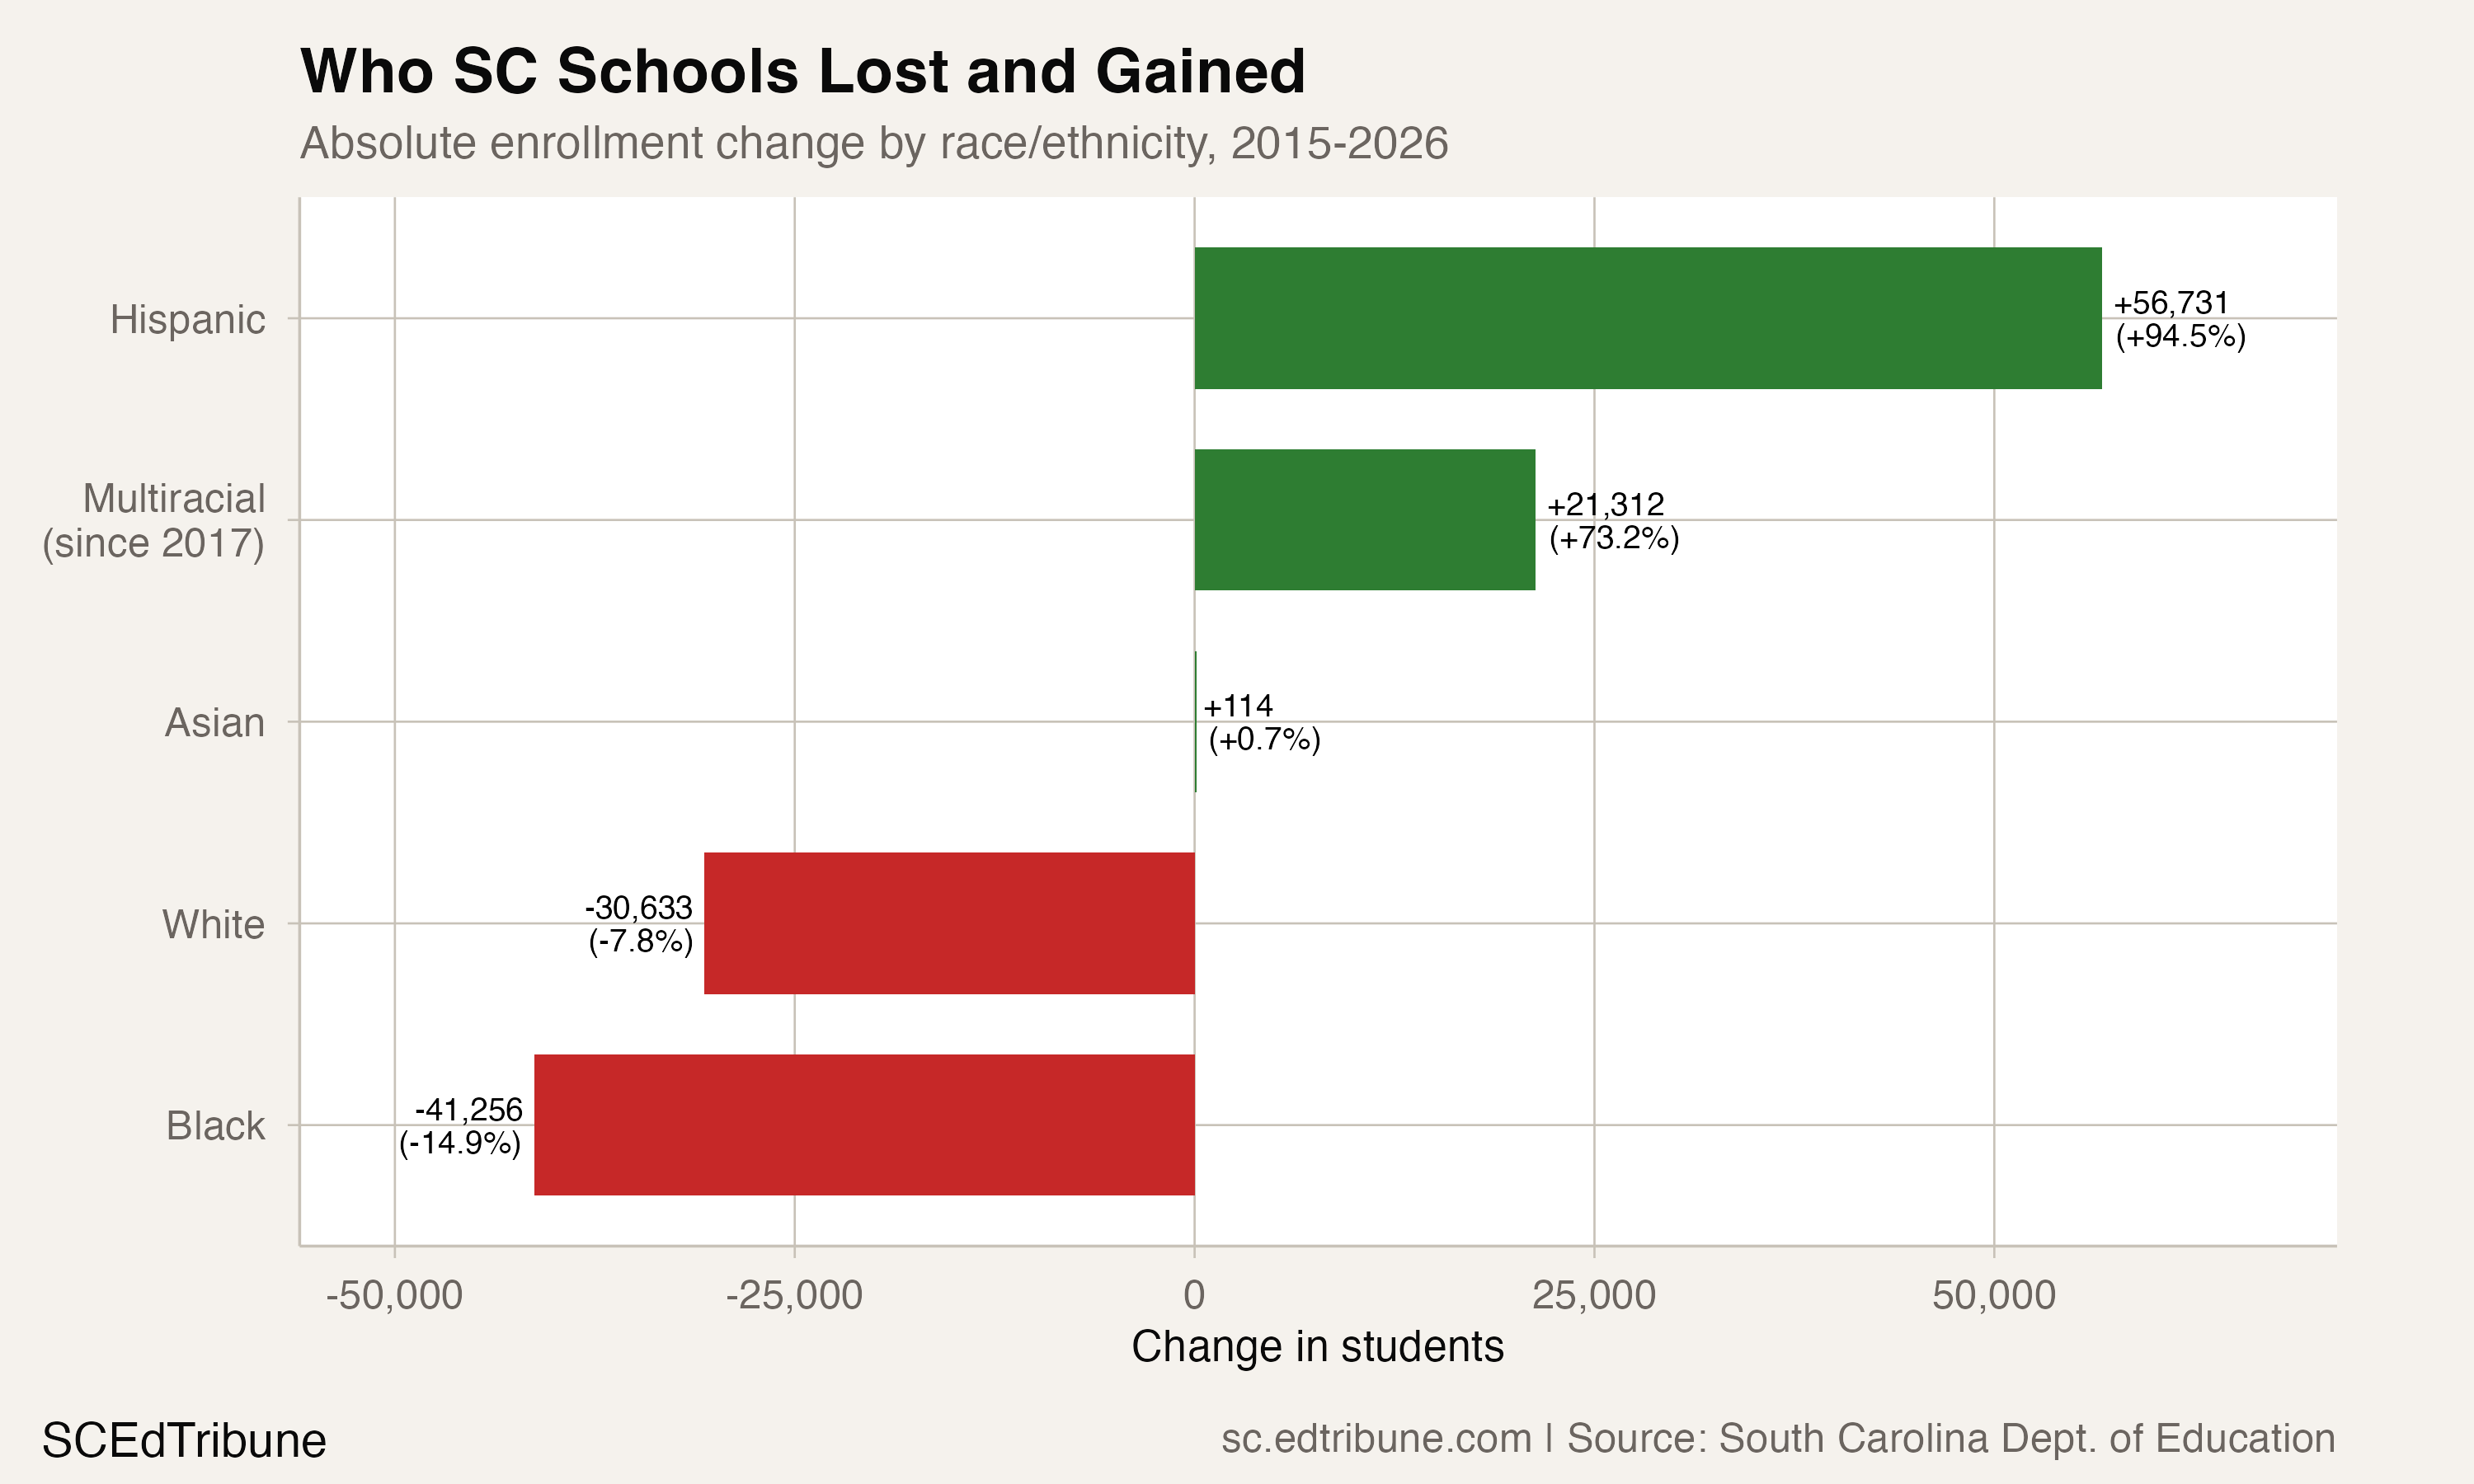
South Carolina's total public school enrollment grew by 32,220 students between 2015 and 2026, a 4.3% gain. Black enrollment fell by 41,256 over the same period, a 14.9% decline. The state added students. Black families lost them.
That gap, the largest absolute loss of any racial group in the state, outpaces white enrollment decline both in raw numbers (-41,256 vs. -30,633) and in percentage terms (-14.9% vs. -7.8%). Black students now represent 30.0% of South Carolina's public school population, down from 36.7% in 2015. In a state where one in three public school students was Black a decade ago, the ratio is approaching one in four.
A reclassification break, then a real decline
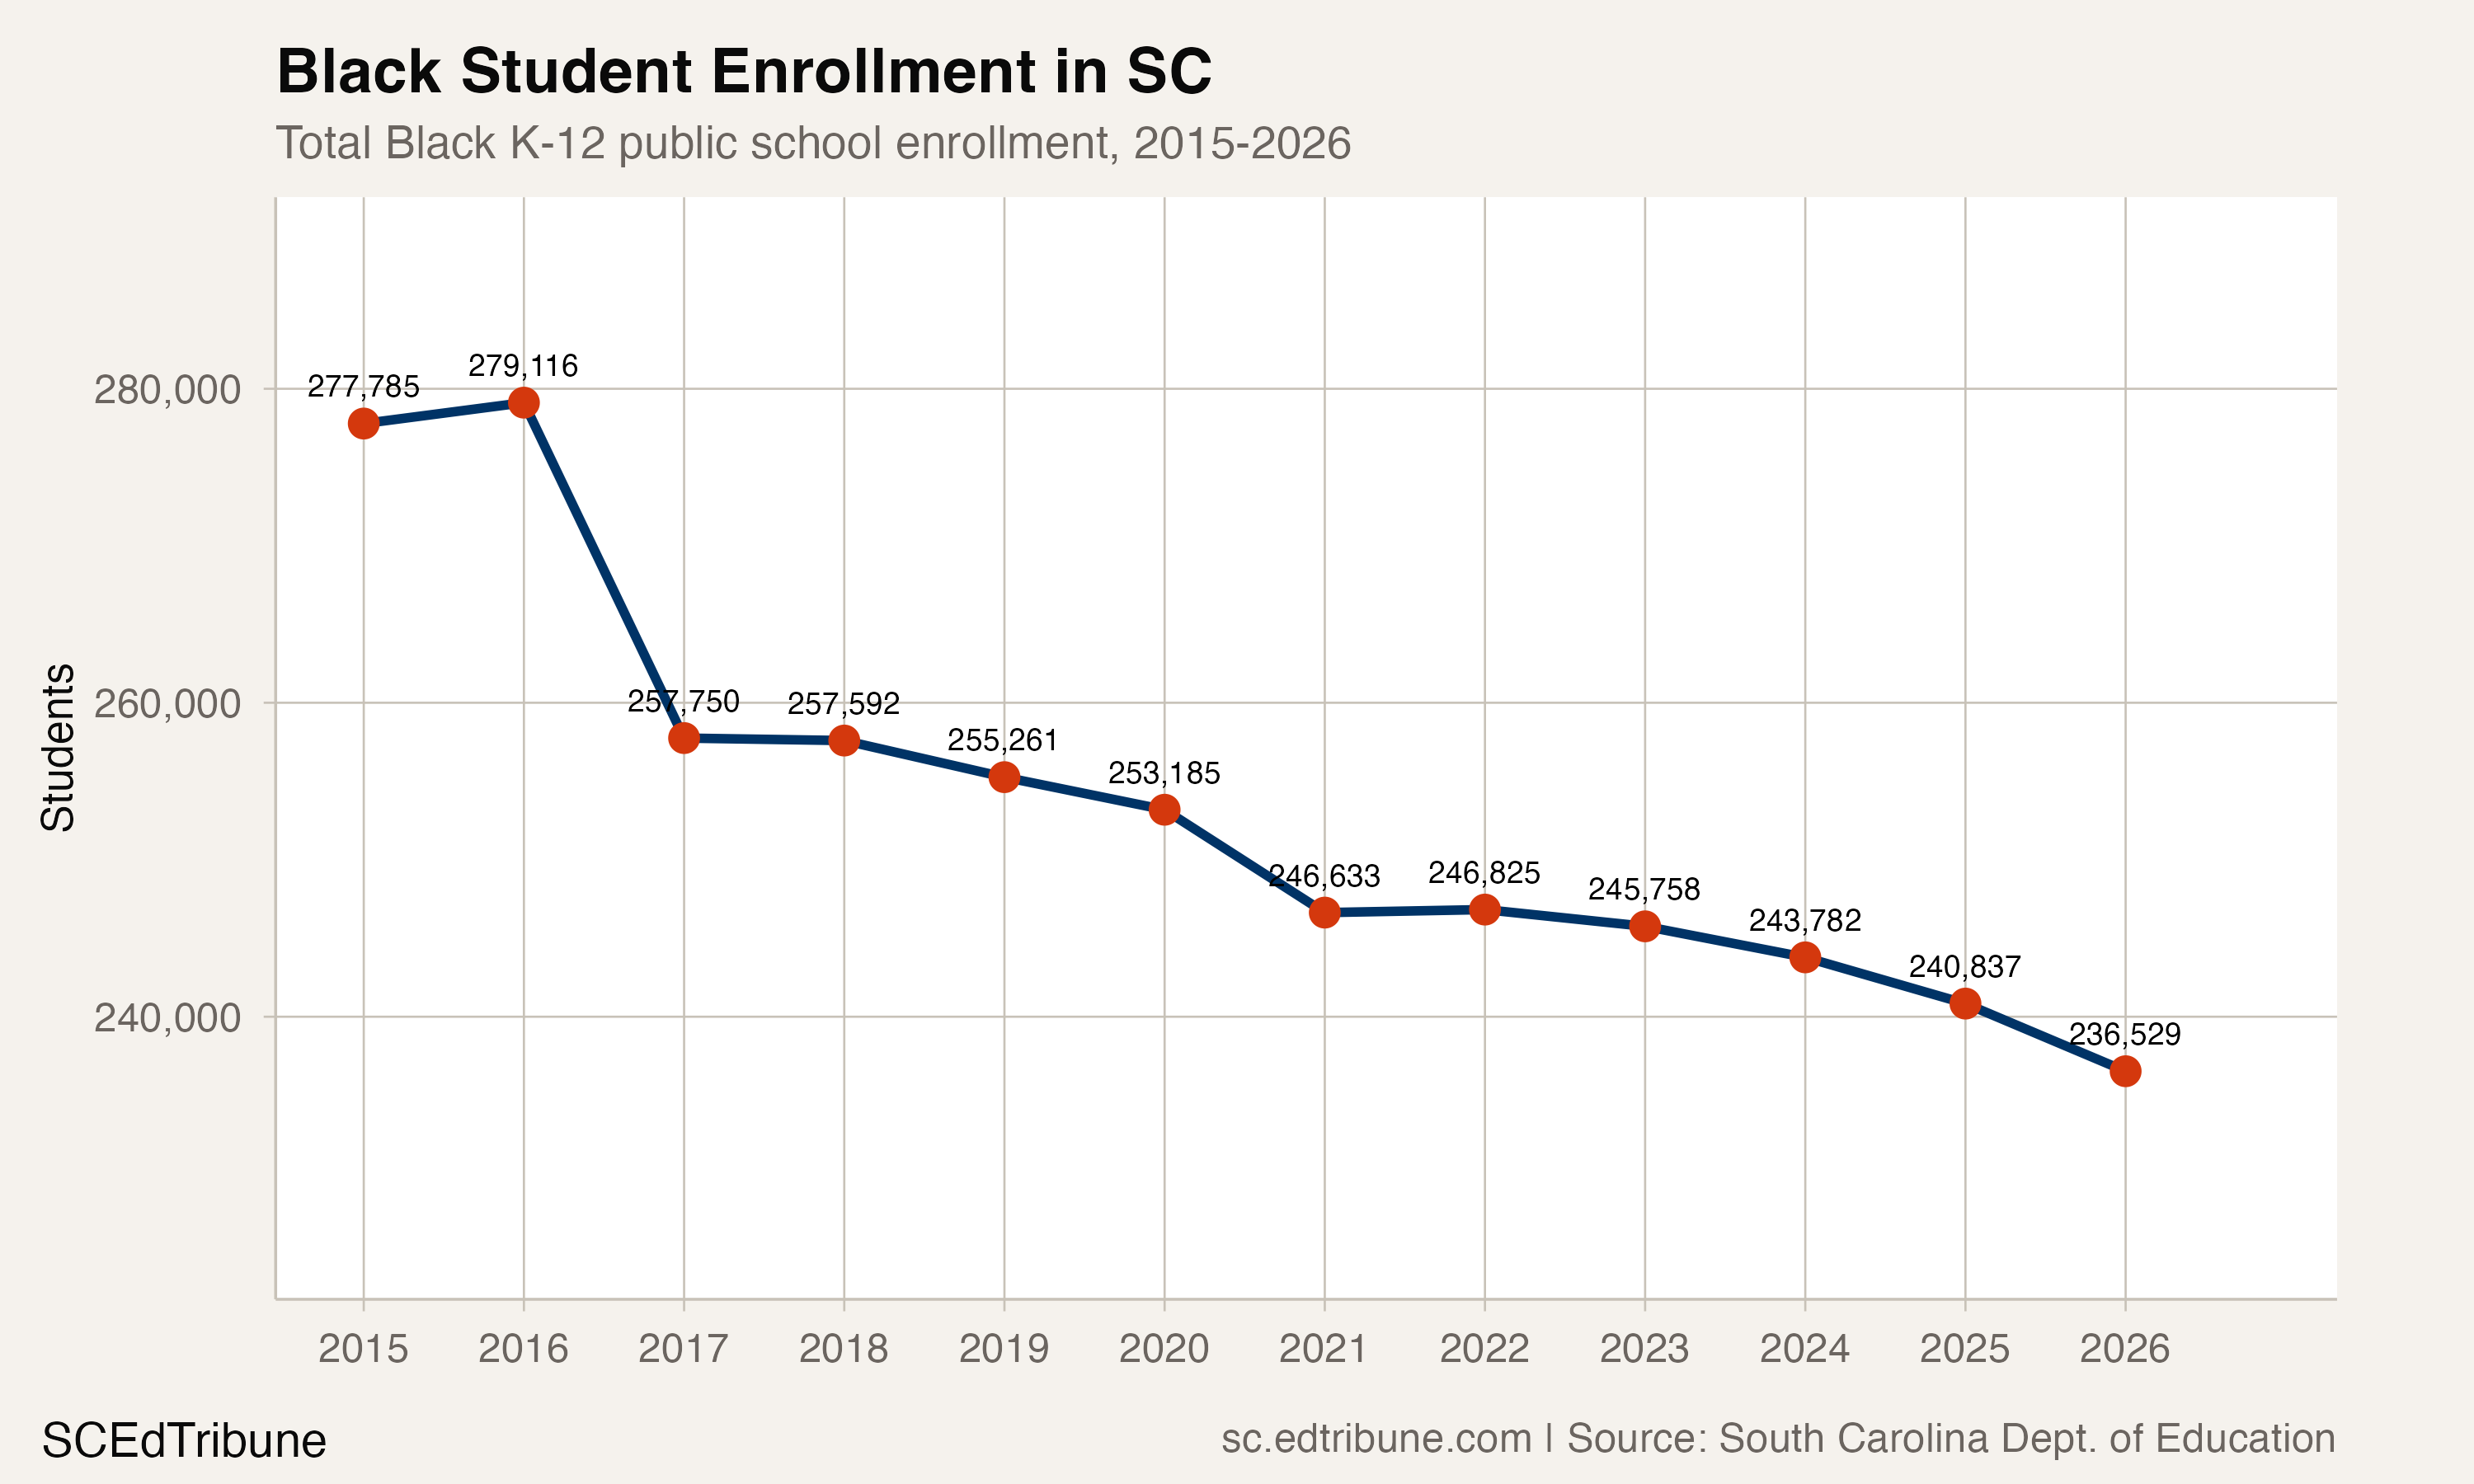
The trendline carries a significant caveat. Between 2016 and 2017, reported Black enrollment dropped by 21,366 students in a single year. That same year, multiracial students appeared as a new reporting category with 29,119 students. The most likely explanation is a federal reporting standards change that reclassified students previously counted under single-race categories, including Black, into the new multiracial group. This is not an exodus; it is a reclassification.
The decline after that break is real. From 2017 to 2026, Black enrollment fell from 257,750 to 236,529, a loss of 21,221 students (8.2%) over nine years. Black enrollment has declined in nine of the 11 year-over-year transitions since 2015, with the only gains coming in 2016 (+1,331) and a negligible bounce in 2022 (+192).
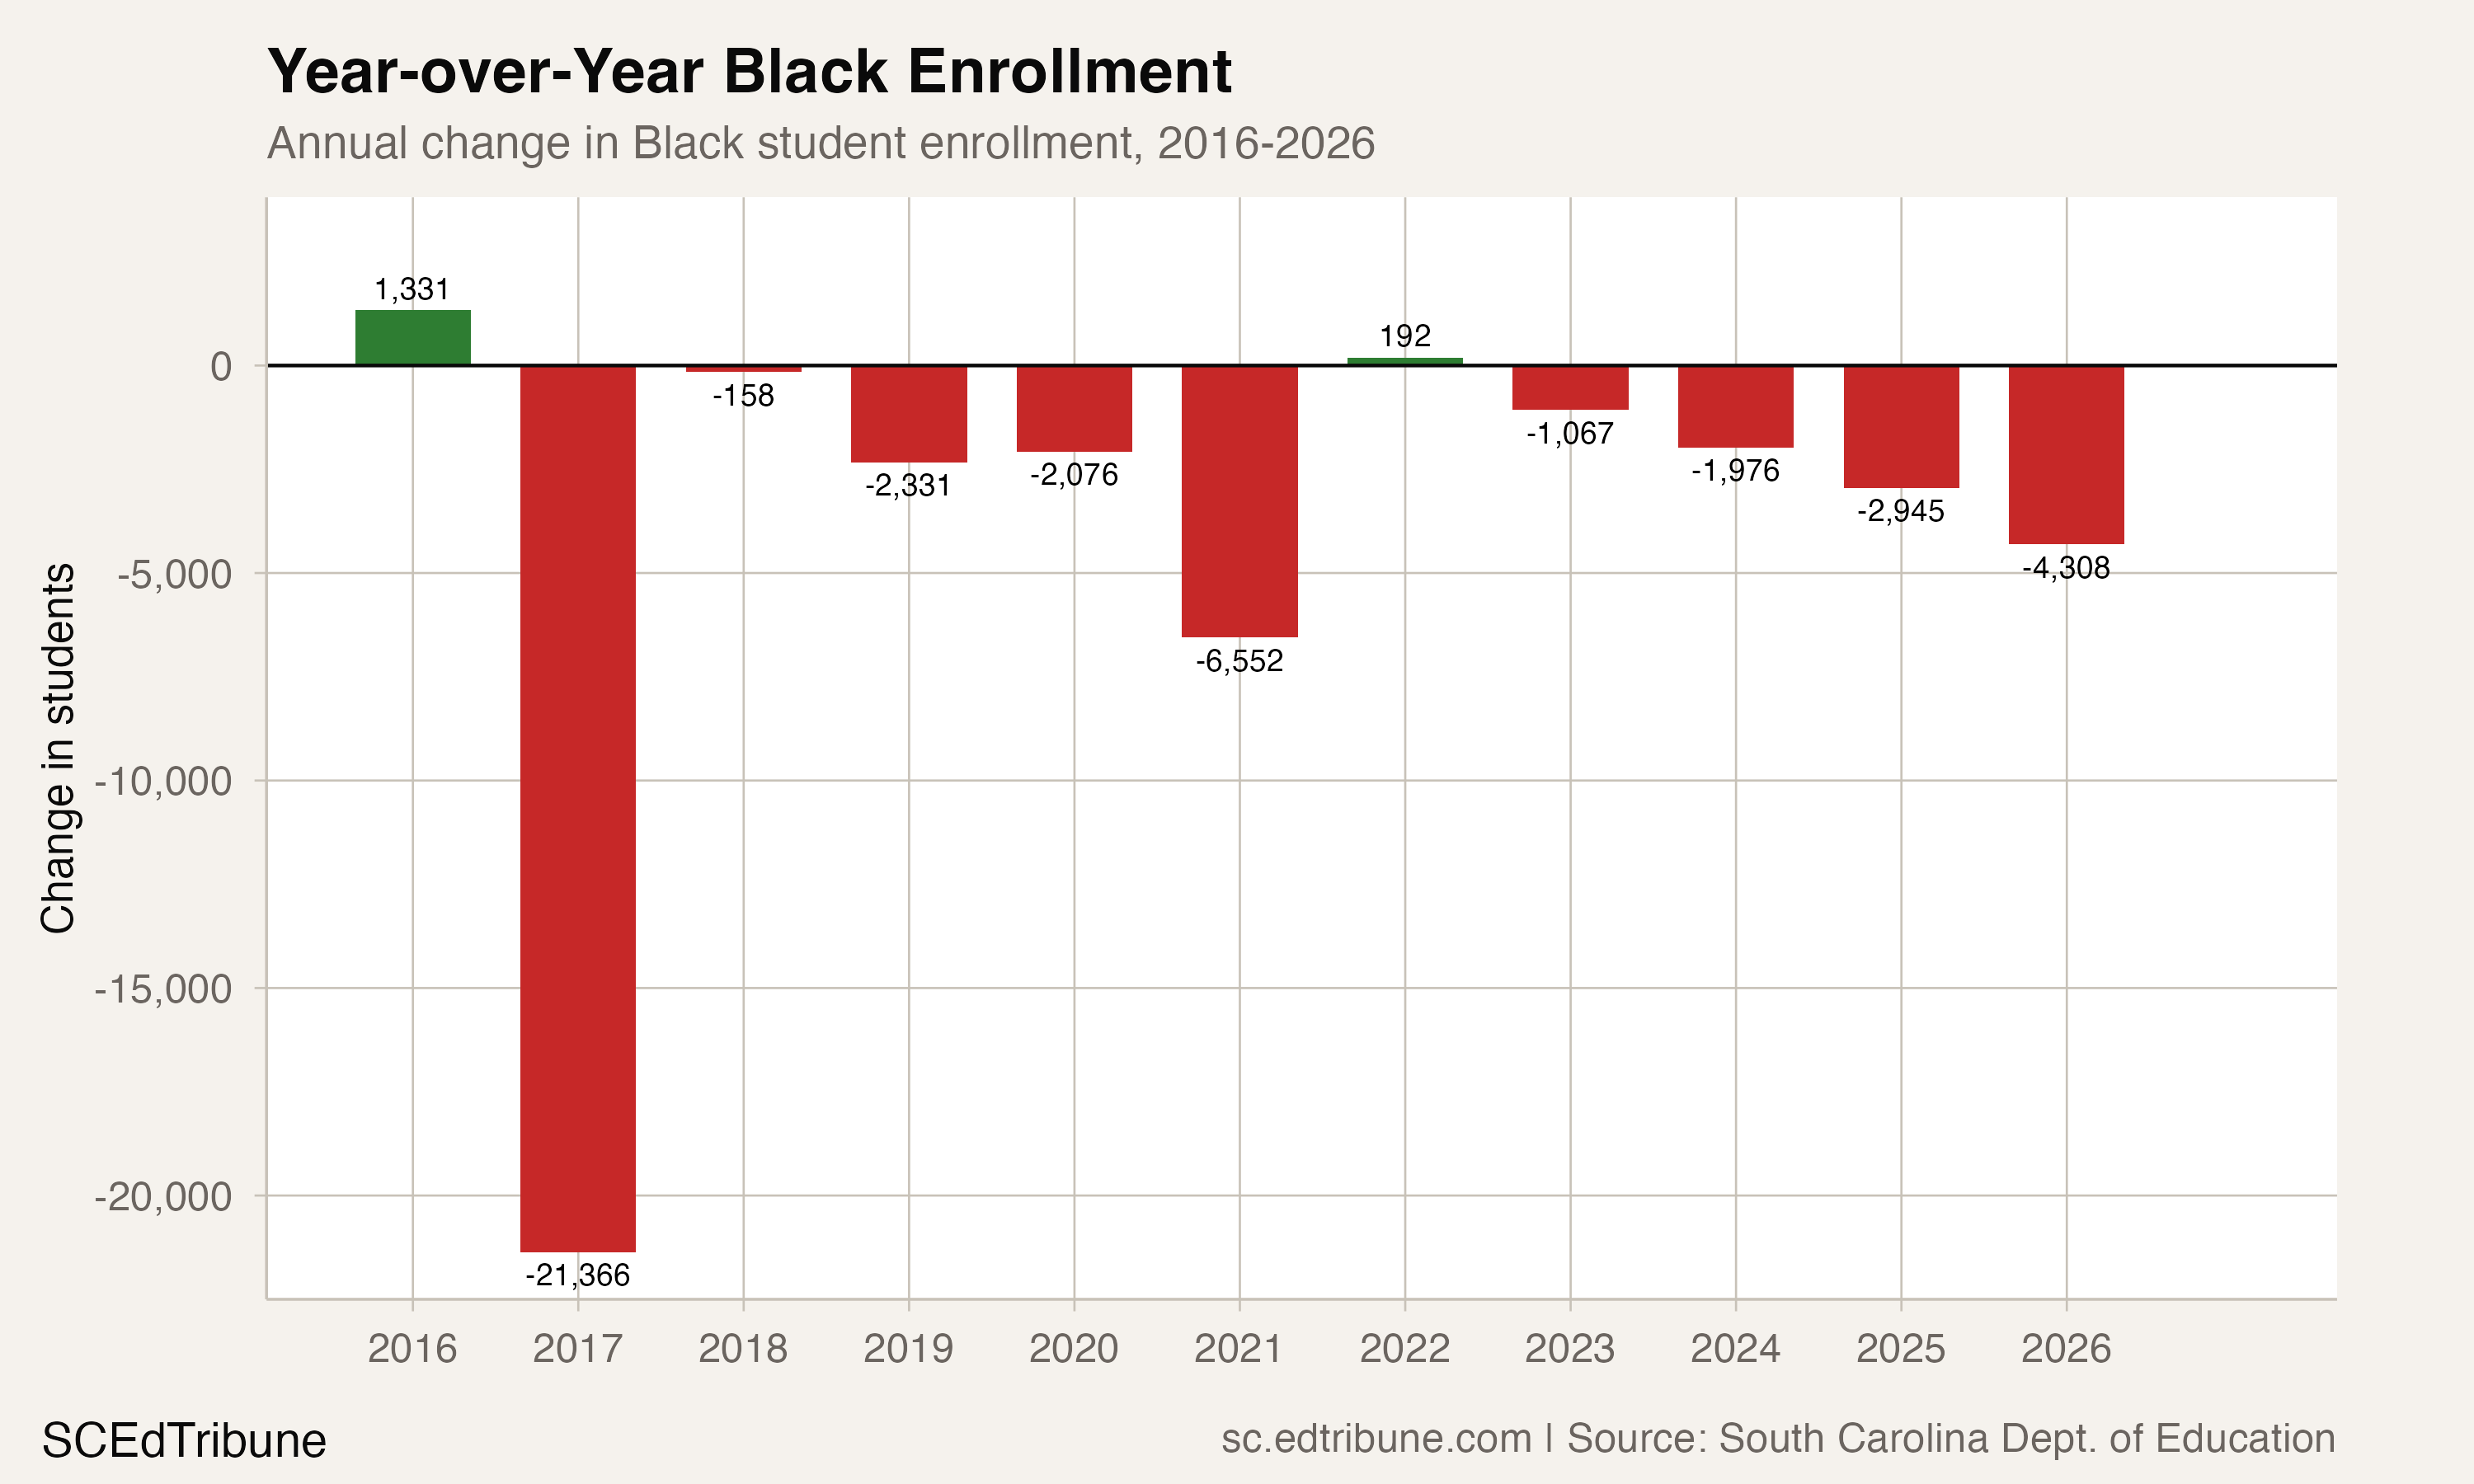
The 2026 decline of 4,308 students is the largest single-year drop since the reclassification break. It follows a 2,945-student loss in 2025. The trajectory is accelerating.
The geography of loss
The decline is not evenly distributed. Charleston 01↗ET lost 6,975 Black students since 2015, a 34.7% decline and the largest absolute loss of any district. Richland 01↗ET, which includes Columbia, lost 4,730 (-25.4%). Greenville 01↗ET lost 2,844 (-14.5%). Horry 01↗ET, the Myrtle Beach corridor, lost 2,320 (-23.2%).
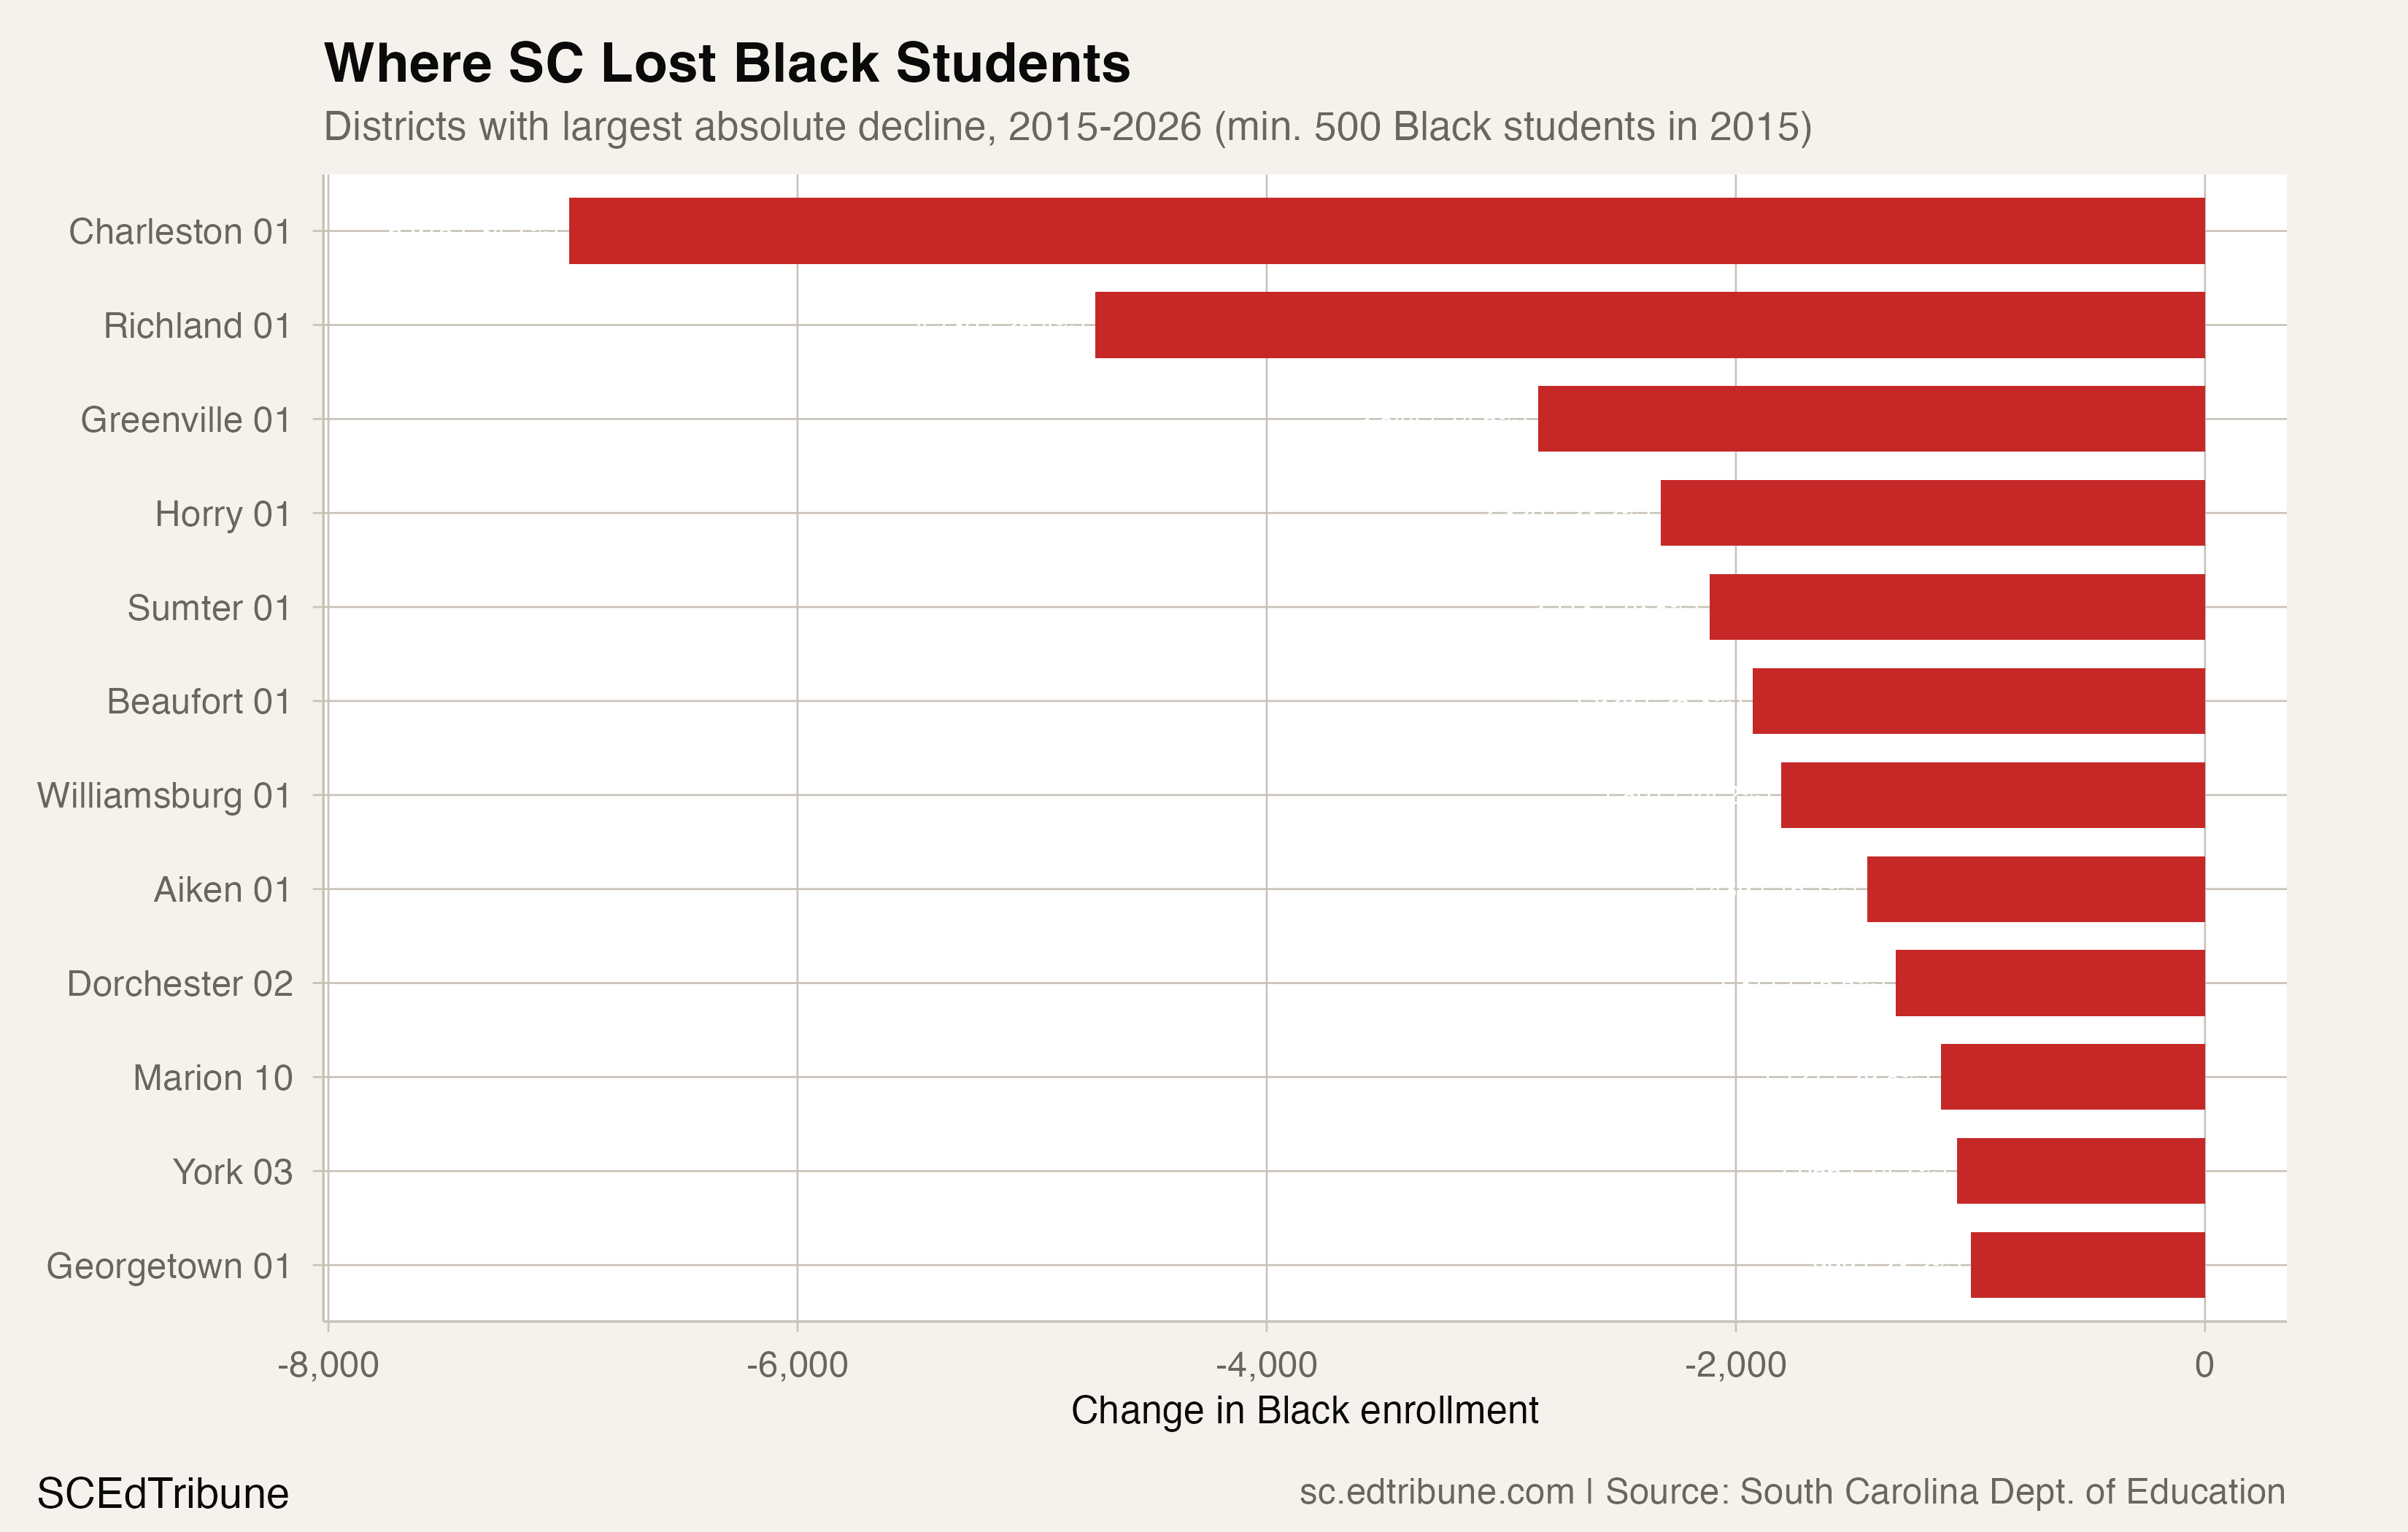
The I-95 Corridor districts, the communities at the center of the Abbeville County School District v. State of South Carolina funding adequacy lawsuit, bear some of the steepest percentage losses. Williamsburg 01↗ET lost 44.2% of its Black students. Lee 01 lost 43.3%. Allendale 01 lost 43.2%. These are districts where Black students make up the overwhelming majority of enrollment, so the losses translate directly into school closures and consolidated classrooms.
The combined Black enrollment loss across I-95 Corridor districts is 7,883 students. The South Carolina Revenue and Fiscal Affairs Office projects that many of these counties will lose an additional 20% or more of their total population by 2042. The enrollment numbers are tracking that trajectory early.
Only a handful of districts gained Black students. Richland 02↗ET, the suburban district northeast of Columbia, added 1,110 (+6.6%). Lexington 01 added 501 (+15.8%). The SC Public Charter School District gained 3,159 Black students (+86.3%), though this largely reflects the charter sector's overall expansion rather than a pattern specific to Black families. Even where Black enrollment grew, the gains were modest compared to the losses elsewhere.
Rural depopulation and a state growing in the wrong places
South Carolina is one of the fastest-growing states in the country. Between July 2024 and July 2025, the state gained nearly 80,000 residents, a 1.5% growth rate that led the nation. But that growth is concentrated in coastal and suburban communities that are disproportionately white and Hispanic. The rural Black Belt counties along I-95 are emptying.
Population declines are hitting counties with the largest share of Black residents hardest. Allendale, the state's poorest county, has lost nearly 35% of its population over the past two decades. Marion County could lose 32% of its population by 2042, according to state projections. The Pee Dee region, including Darlington, Dillon, Clarendon, Florence, Marion, Marlboro, and Williamsburg counties, faces a projected average population decline of 22% by 2042.
This is not a school problem. It is a structural economic problem that shows up in school enrollment first. When a rural county loses its manufacturing base or hospital, the families who can move do. The enrollment data records who left.
A competing explanation: multiracial reclassification may account for a portion of the ongoing decline as well. Since 2017, multiracial enrollment has grown by 21,312 students (+73.2%). Some share of students who might have been identified as Black in prior years are now reported as multiracial. The data cannot distinguish between a family that moved away and a family whose child's racial classification changed on a school form.
The composition shift
The Black enrollment decline is one dimension of a broader transformation. Hispanic enrollment nearly doubled from 60,023 to 116,754 (+94.5%), adding 56,731 students. White enrollment fell by 30,633 (-7.8%). The Black-Hispanic gap, once 217,762 students, has narrowed to 119,775.
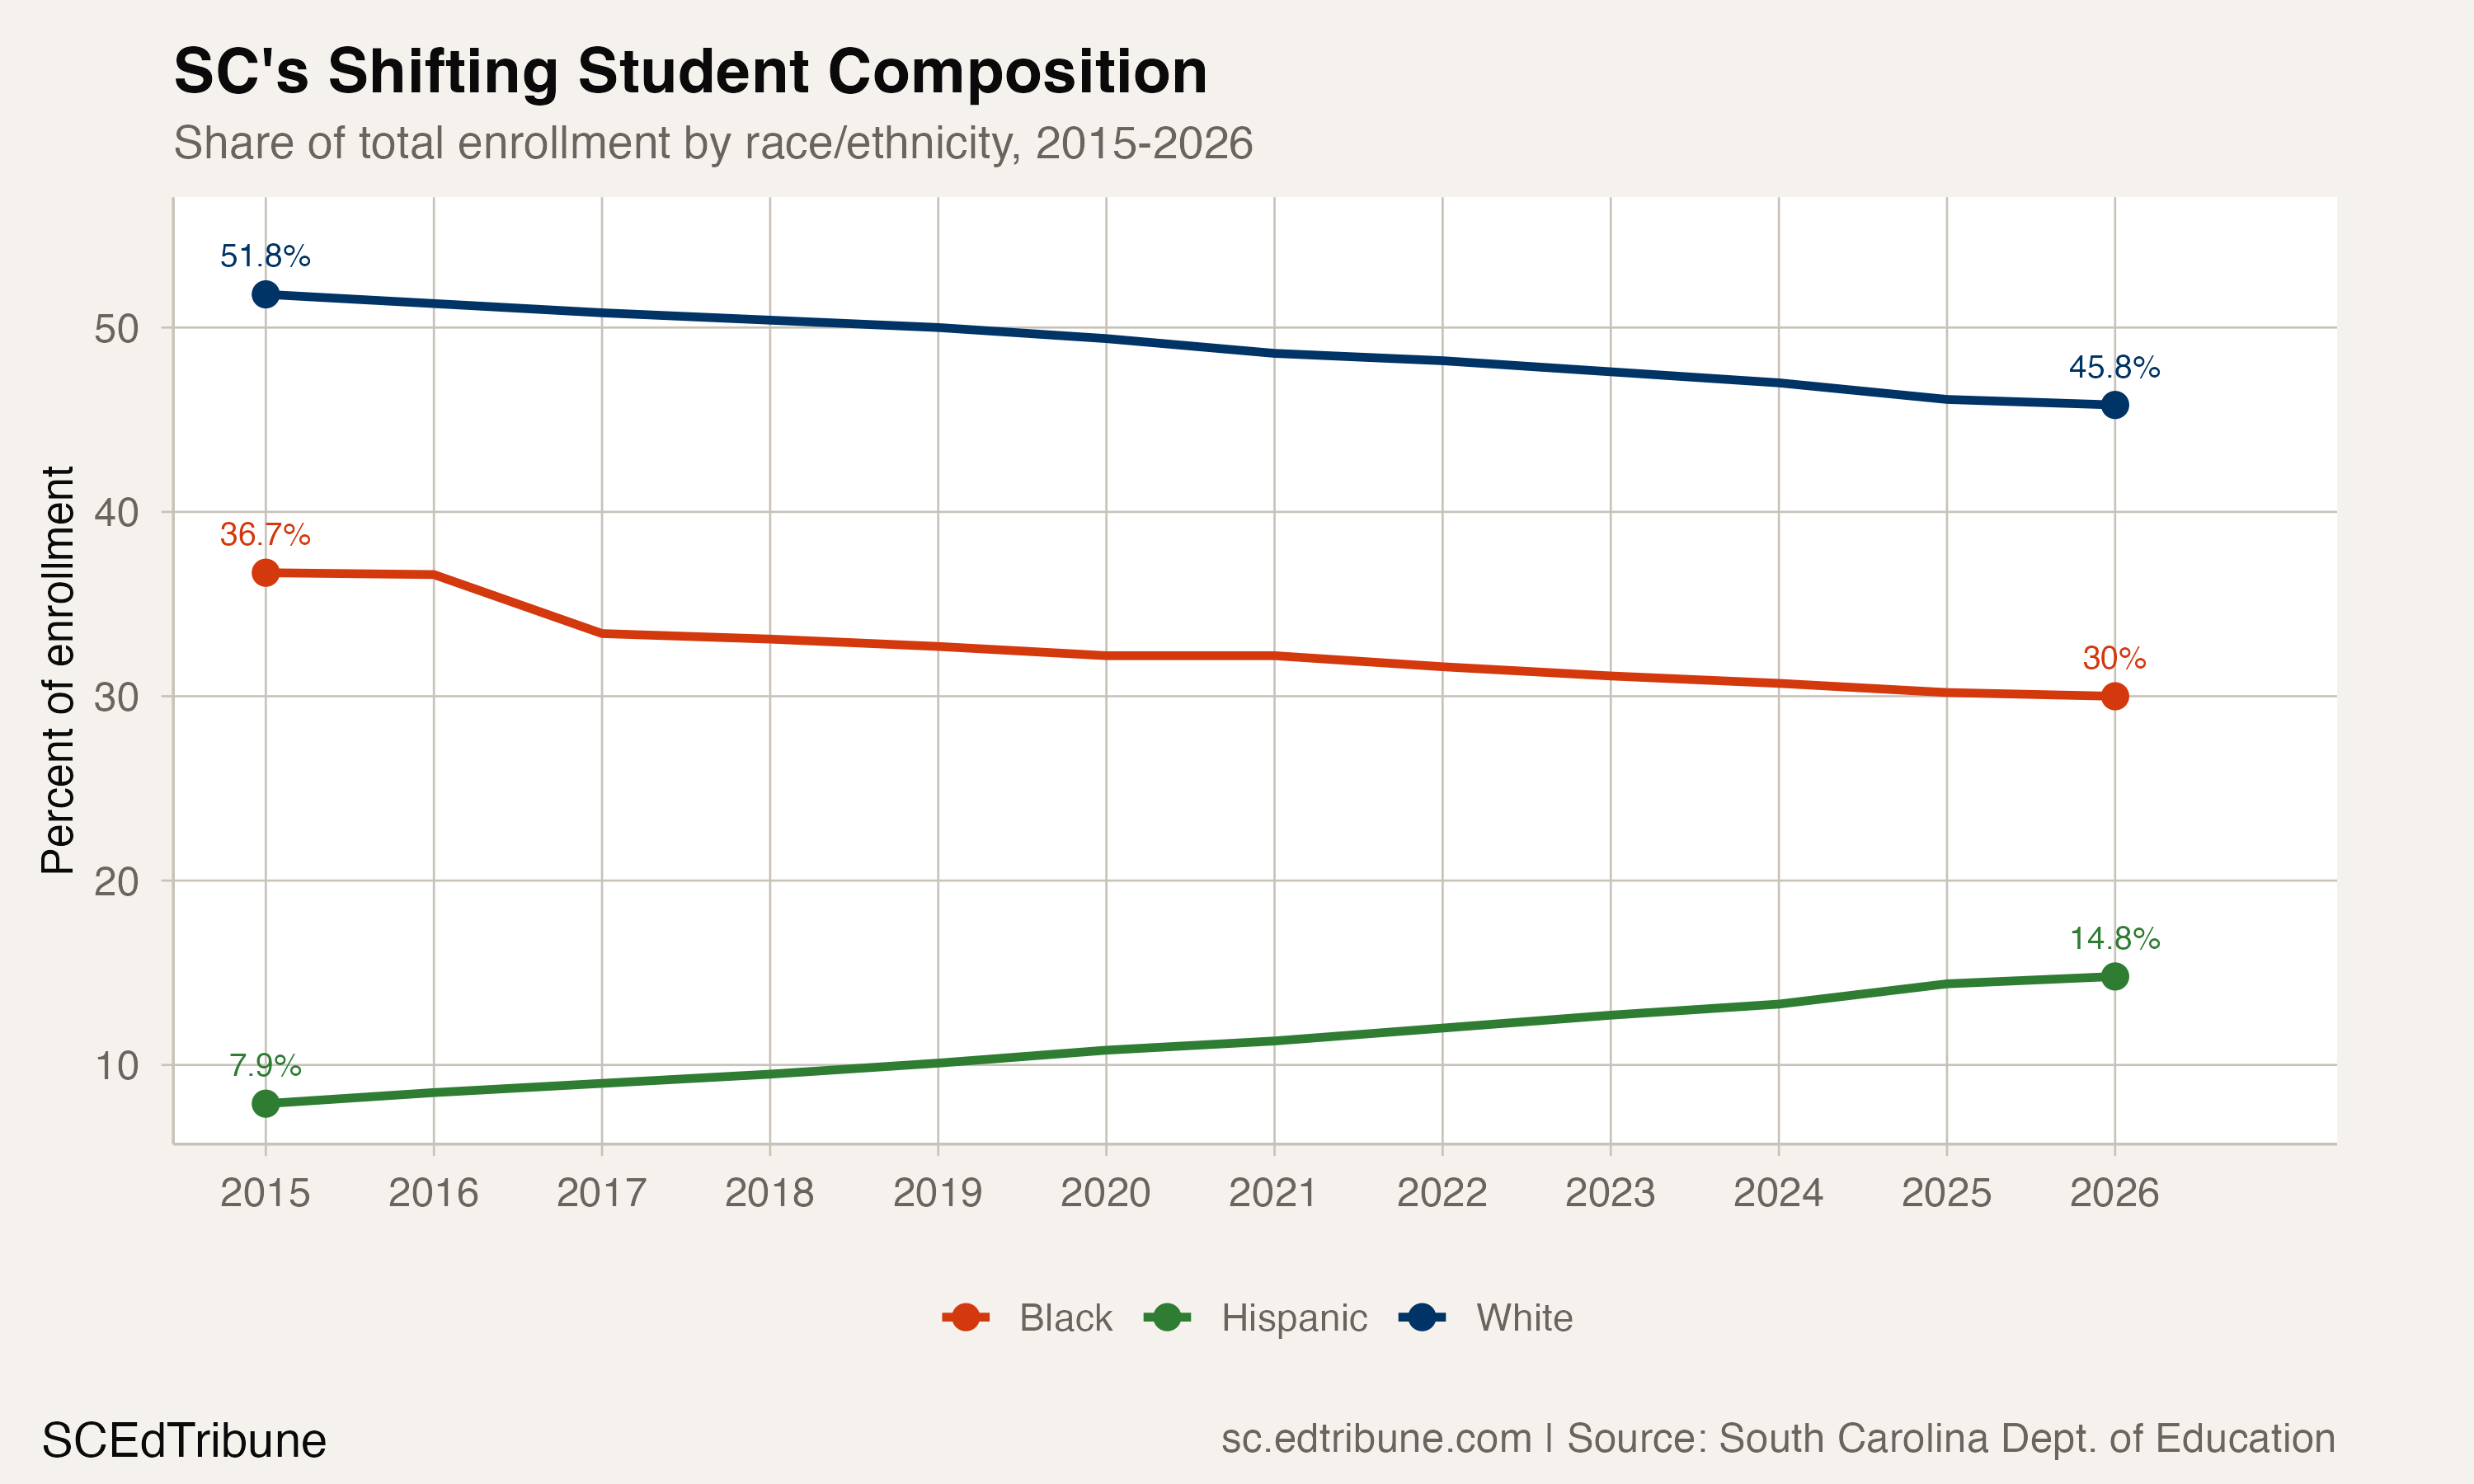
Black students' share of enrollment dropped 6.7 percentage points, from 36.7% to 30.0%. White students' share fell 6.0 points, from 51.8% to 45.8%. Hispanic students' share more than doubled from 7.9% to 14.8%. In absolute terms, the racial group losing the most students is the one that was already underserved by the state's school funding system.
The funding shadow
The Abbeville lawsuit established that the state had failed to provide a "minimally adequate education" to students in its poorest rural districts. The South Carolina Supreme Court ruled in 2014 that the state bore primary responsibility, finding "a clear disconnect between the inputs and outputs of the education system." More than a decade later, the districts named in that lawsuit are still losing students at rates that dwarf the state average.
"Over 100,000 students participate in Free and Reduced Lunch programs. Twenty-one of the 34 [Abbeville] districts have more than 90% participation rates." -- Palmetto Promise Institute
Meanwhile, the state's new school choice program is expanding. South Carolina's Academic Choice in Education (ACE) Scholarship program, passed in the 2025-2026 legislative session, creates tax-credit-funded scholarships for families earning up to 400% of the federal poverty level, with tiered amounts for general, disadvantaged, and exceptional-needs students. The program's long-term effect on Black enrollment in public schools is unknown. But in a state where per-student funding was $16,463 in Marion County compared to more than $26,000 in Charleston County during the 2024-25 school year, the districts losing Black students fastest are also the ones least equipped to absorb the per-pupil funding loss when students leave.
What the next decade looks like
Black enrollment never recovered from COVID. After a brief 192-student bounce in 2021-22, Black enrollment resumed declining and by 2025-26 had fallen to 236,529, more than 10,000 students below its pandemic trough of 246,633 in 2020-21. White enrollment recovered substantially. The divergence means the post-pandemic period has widened the gap between Black enrollment's trajectory and every other group's.
The losses are accelerating: 1,976 in 2024, 2,945 in 2025, 4,308 in 2026. If the I-95 Corridor counties continue to depopulate at projected rates, and if suburban districts like Richland 02 and Lexington 01 absorb only a fraction of the families leaving, the state could lose another 20,000 Black students by the mid-2030s.
That would mean South Carolina's public schools lost a quarter of their Black students in two decades, in a state that is simultaneously growing faster than nearly every other in the country.
Detailed code that reproduces the analysis and figures in this article is available exclusively to EdTribune subscribers.
Discussion
Sign in to join the discussion.
Loading comments...