South Carolina's chronic absenteeism rate peaked in 2022-23 and has declined for two consecutive years. Most districts followed that arc, improving as the worst of the post-COVID attendance disruption faded. School District of Oconee County↗ET did not.
Oconee's chronic rate has risen every year the state has measured it: 19.3% in 2021-22, 21.2% in 2022-23, 22.8% in 2023-24, and 23.2% in 2024-25. It is one of only two districts with more than 10,000 students that has worsened in every year of available data, alongside Florence One. While the state improved 2.5 points from its 2023 peak, Oconee added 2.0 points. The district is now 0.9 points above the state average, a position it reached from below average just three years ago.
A quiet deterioration
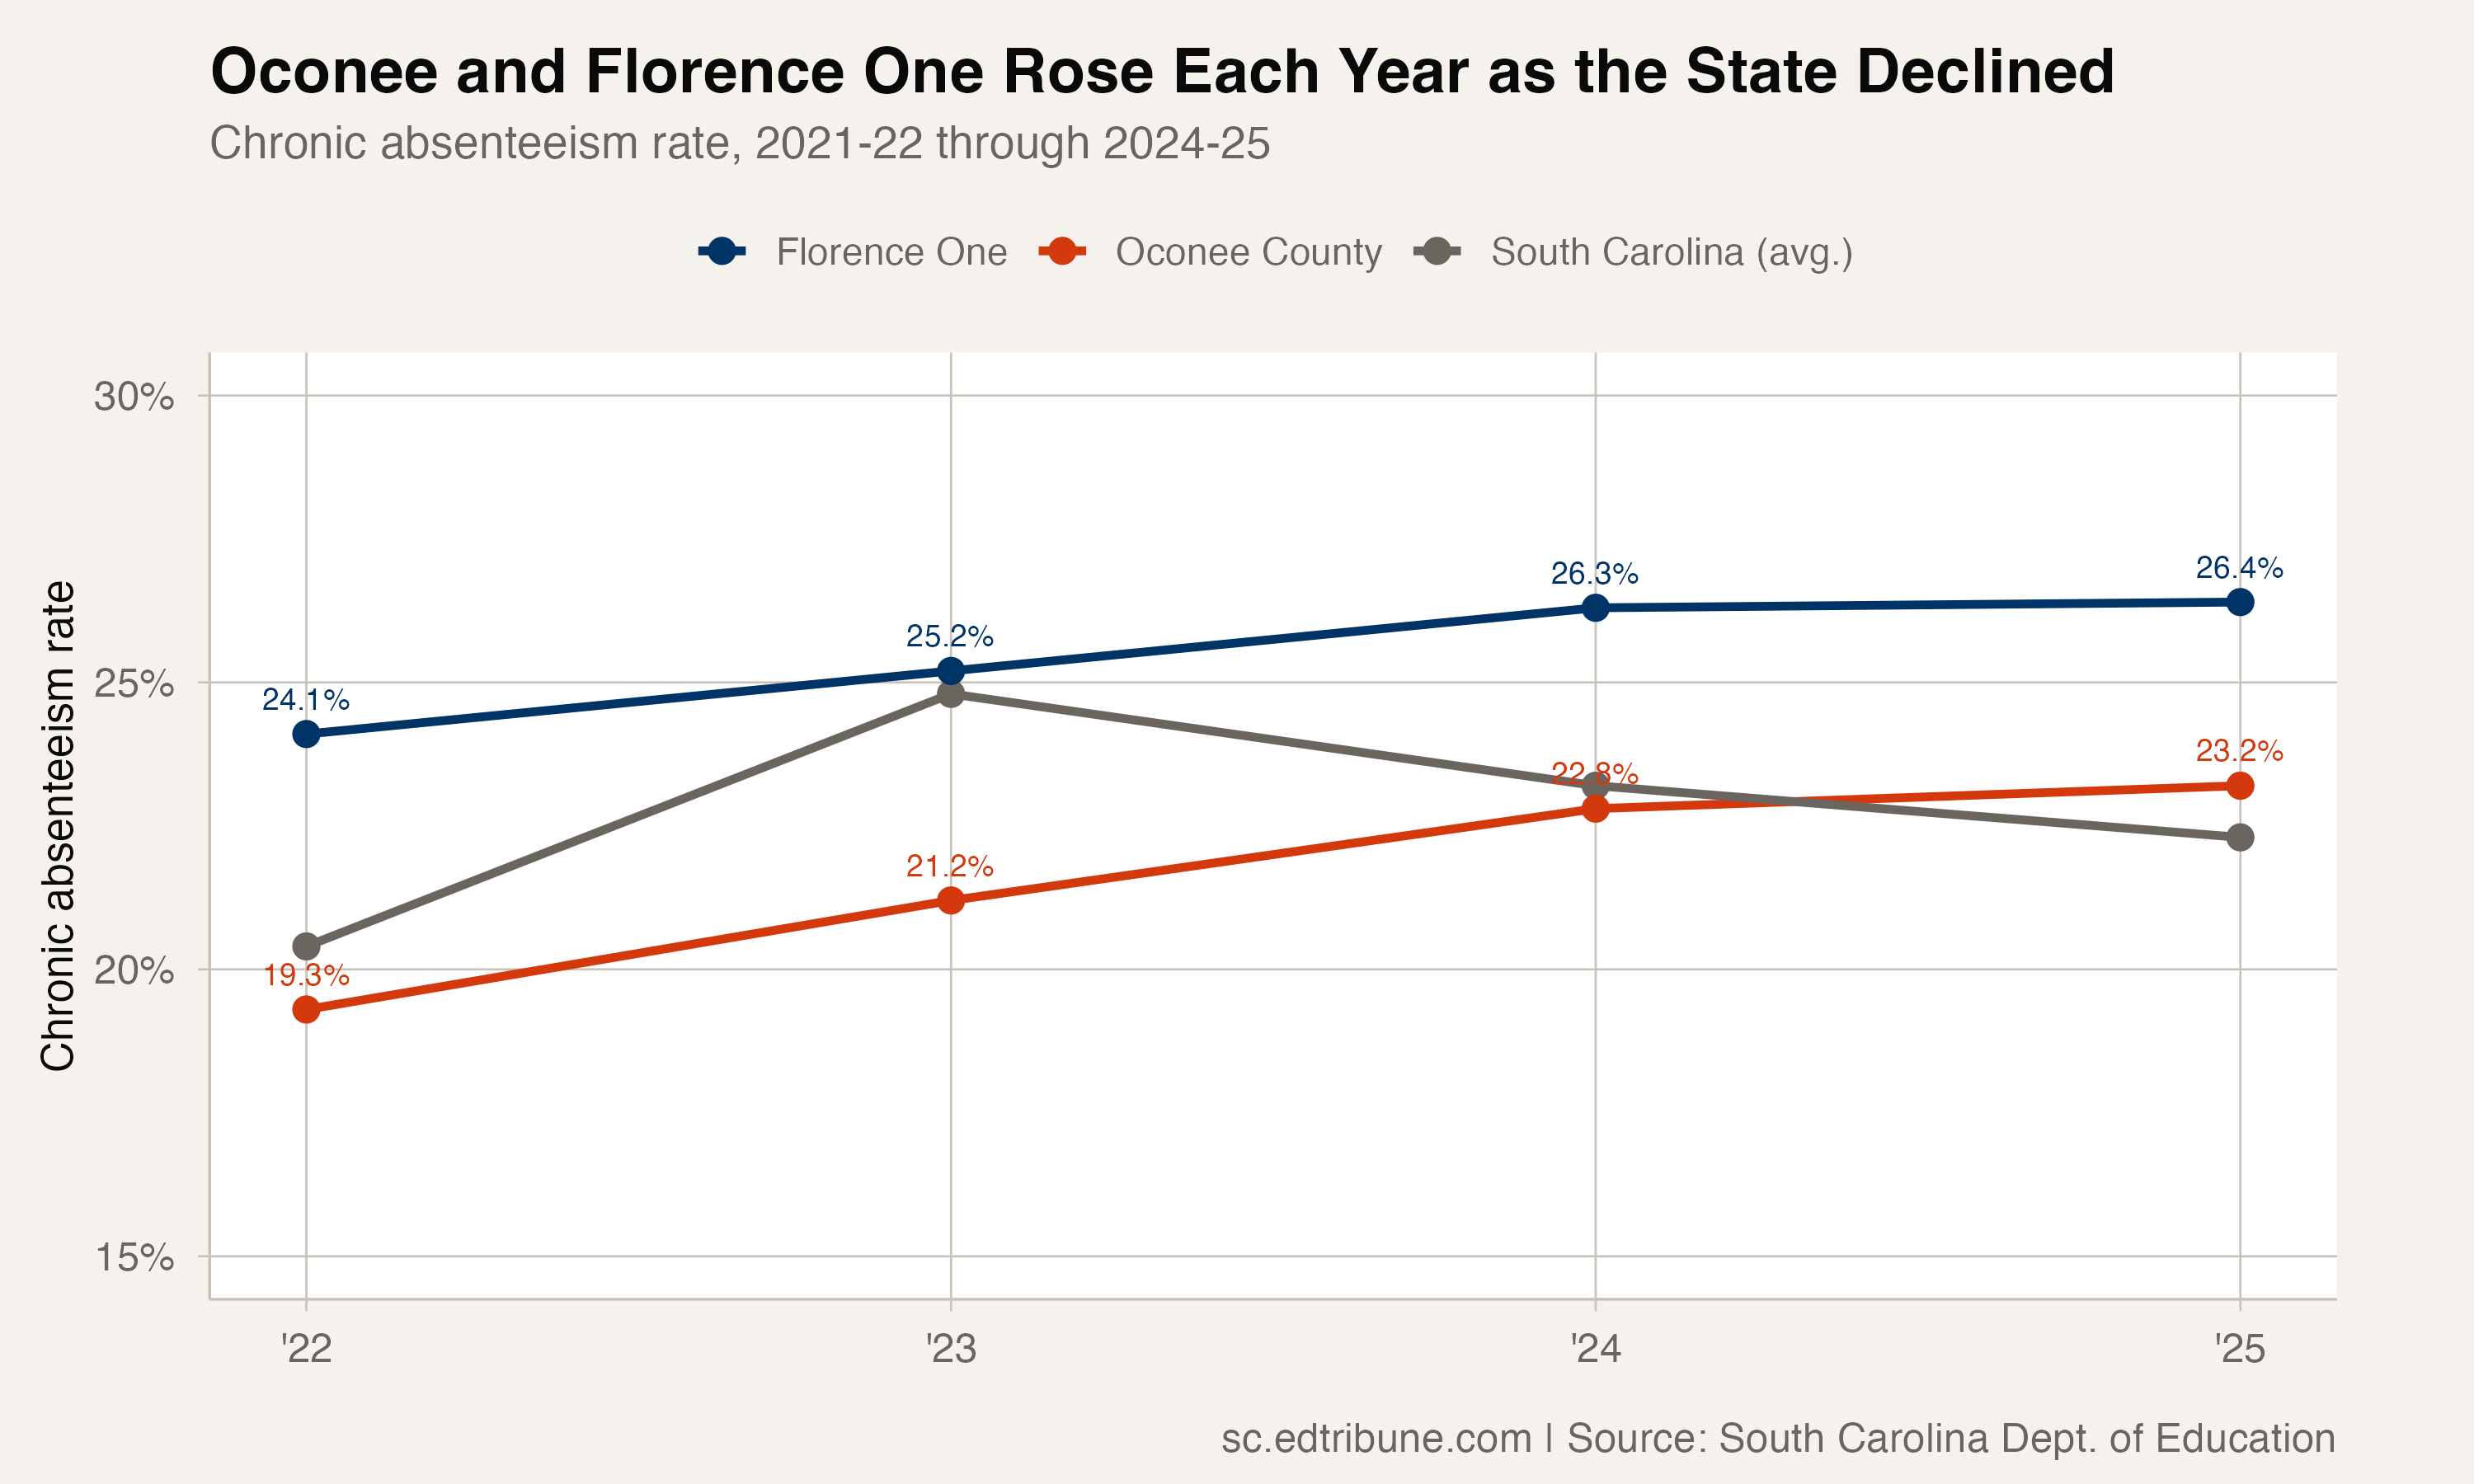
The magnitude of each year's worsening is small: 1.9 points, then 1.6, then 0.4. The 2024-25 increase of just 0.4 points could be read as stabilization. But the direction is consistent, and it places Oconee on the wrong side of a state that is broadly recovering.
Oconee is a 10,285-student district in the Blue Ridge foothills of the far western Upstate, bordering Georgia. It is a community where the economy is anchored by small manufacturers, a Duke Energy nuclear plant, and tourism around Lake Keowee. It is not a district facing the kind of concentrated poverty that defines the Corridor of Shame. Oconee's chronic rate would not make headlines in Allendale or Sumter. The story is not the number itself but the direction.
Florence One: the other worsening streak
Florence One Schools↗ET, a 16,699-student district in the Pee Dee region, has followed a similar trajectory: 24.1% in 2021-22, 25.2% in 2022-23, 26.3% in 2023-24, and 26.4% in 2024-25. Like Oconee, Florence One has worsened in each year of available data, though the 2024-25 increase of just 0.1 points suggests the trend may be plateauing.
Florence One is different from Oconee in important ways. It is larger, more urban, serves a higher-poverty population, and sits in a region where chronic absenteeism rates are generally elevated. Its 26.4% rate is 4.1 points above the state average but not dramatically out of line with other Pee Dee districts. What makes it notable is the persistence of the worsening, even as districts around it improved.
Why districts diverge
The statewide recovery from the 2022-23 peak has been uneven. Cherokee County dropped 13.1 points from its peak. Spartanburg Two dropped 11.7 points. These turnaround stories demonstrate that rapid improvement is possible. Oconee and Florence One demonstrate that it is not automatic.
The reasons districts move in different directions when facing the same statewide conditions are not visible in the attendance data alone. They live in local decisions: how a district deploys attendance teams, whether transportation routes reach every student, how the school climate makes students feel about showing up, and whether the community infrastructure around the school supports regular attendance.
What the data does show is that the statewide average, while useful as a benchmark, obscures real divergence at the district level. A state that improves by 2.5 points can still contain districts that worsen by 3.9 points. The average does not describe every student's experience.
Oconee's next year
The 0.4-point increase in 2024-25 is the smallest of Oconee's three annual increases, the first sign the slide may be flattening.
At 23.2%, Oconee sits just 0.9 points above the state average. That is not a crisis. But a rate that has climbed for three straight years while the state recovers is not a trend that corrects itself. The turnarounds in Cherokee County and Spartanburg Two came from deliberate work: attendance teams, family outreach, transportation fixes. They did not come from waiting for the numbers to bend on their own.
Detailed code that reproduces the analysis and figures in this article is available exclusively to EdTribune subscribers.
Discussion
Sign in to join the discussion.
Loading comments...