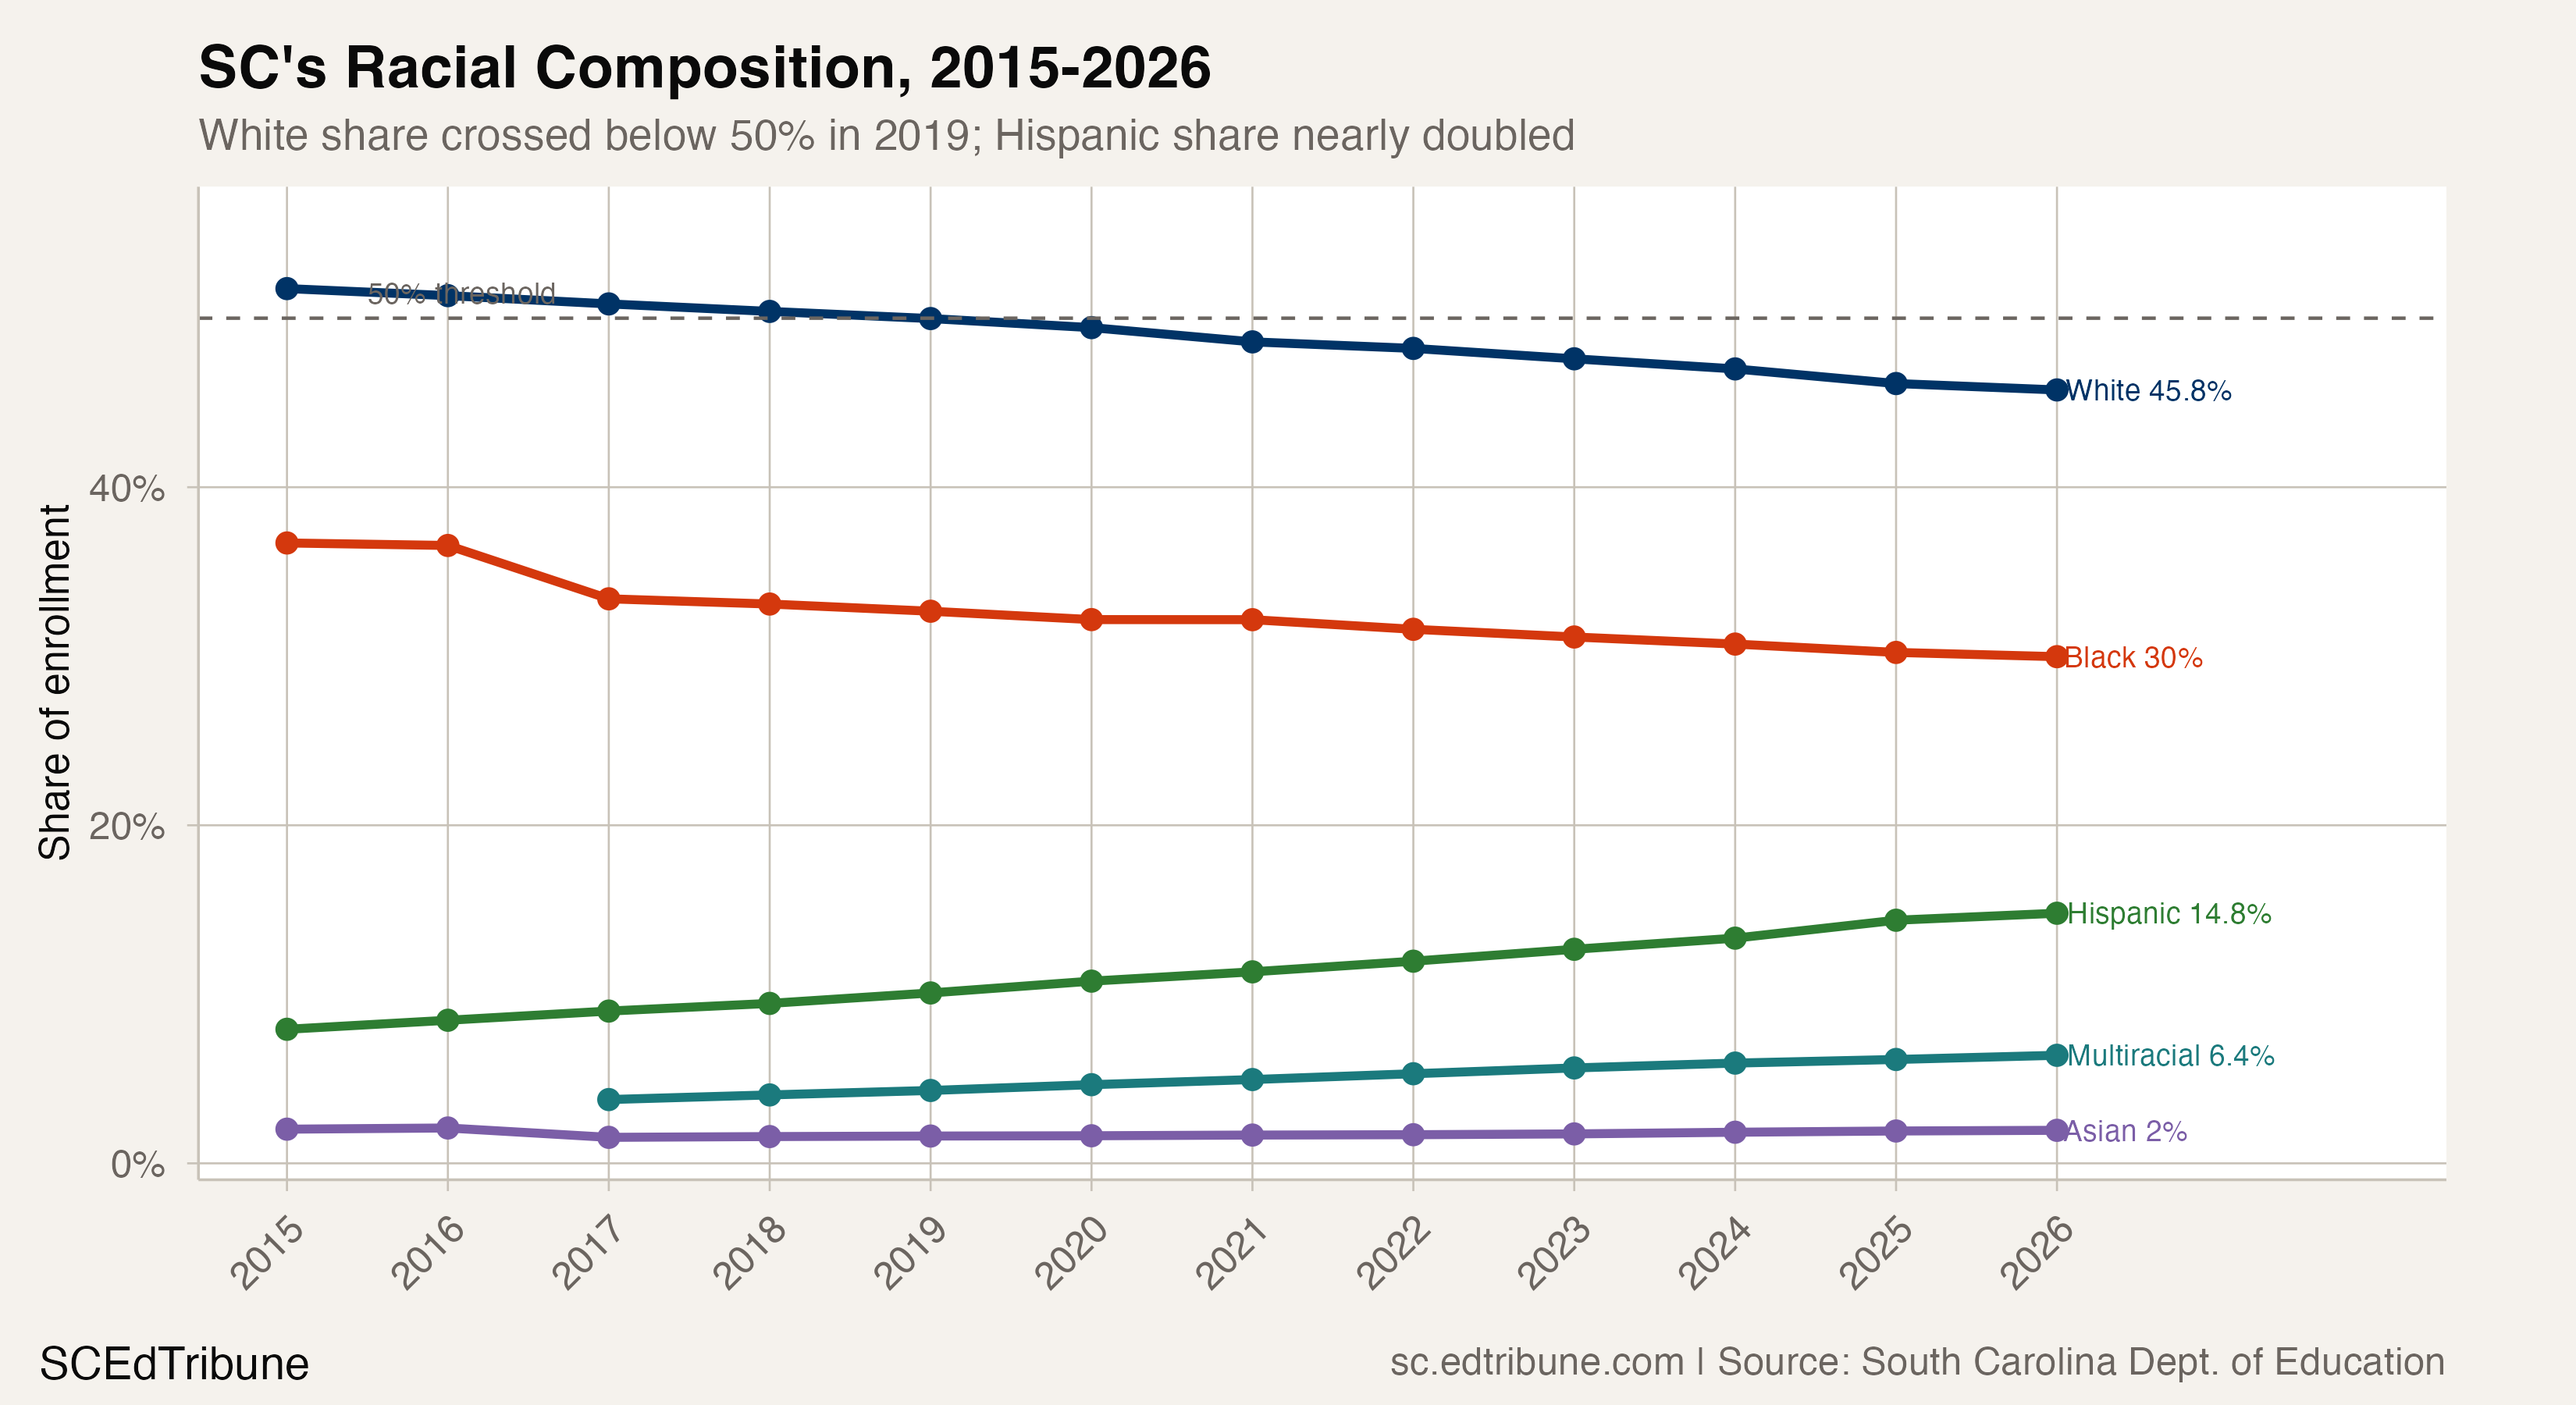
In 2019, for the first time in the state's history, white students dropped below half of South Carolina's public school enrollment. That crossing was not a one-year anomaly. It was a hinge. In the seven years since, white share has fallen another 4.2 percentage points, from 49.98% to 45.76%, and the rate of decline is speeding up.
Between 2015 and 2020, white share fell 2.3 points over five years. Between 2020 and 2026, it fell 3.7 points over six years, a 33% faster annual rate. This is not a state that tipped and stabilized. South Carolina is a state where the underlying demographic engine is still accelerating.
The arithmetic under the headline
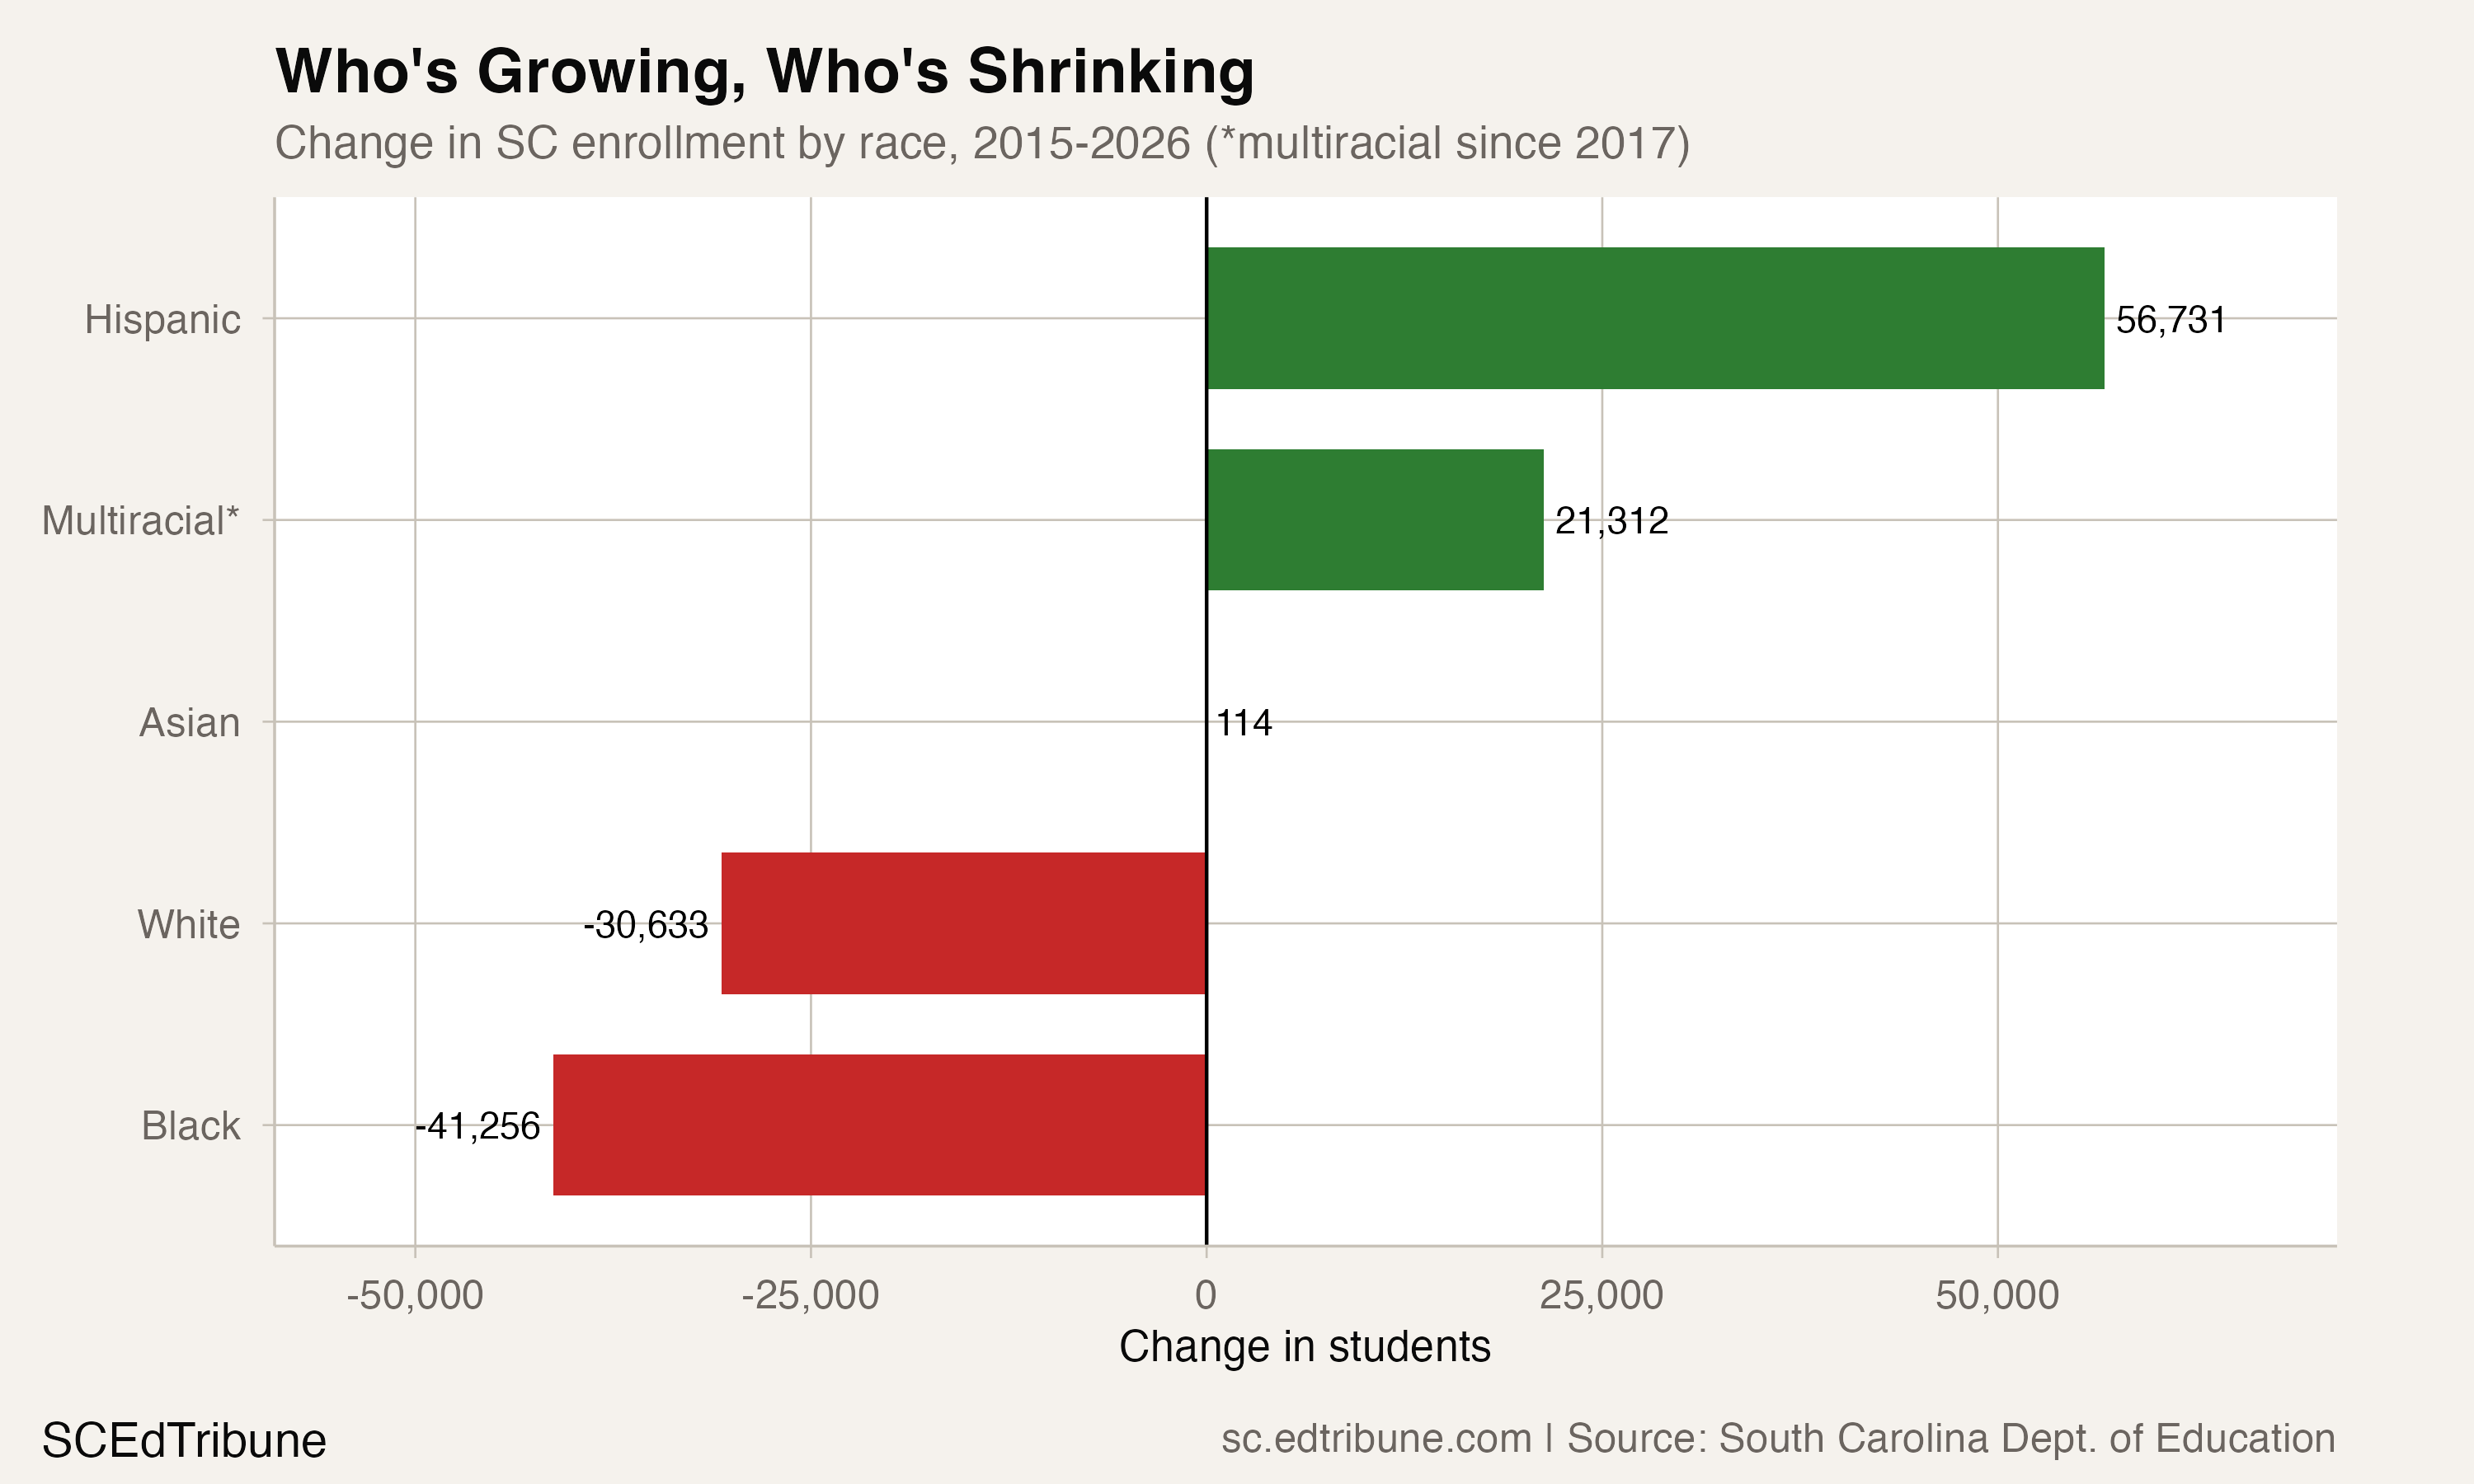
The statewide numbers mask a counterintuitive pattern: South Carolina's total enrollment actually grew 4.3% over this period, from 756,866 to 789,086. The state is gaining students. But the students it is gaining look nothing like the students it is losing.
White enrollment dropped by 30,633 students (-7.8%) since 2015. Black enrollment dropped by 41,256 students (-14.9%), a steeper decline in both absolute and percentage terms. Together, these two groups lost 71,889 students.
Hispanic enrollment nearly doubled over the same period. From 60,023 students in 2015 to 116,754 in 2026, a gain of 56,731 (+94.5%). Hispanic students went from 7.9% of enrollment to 14.8%. Multiracial students, tracked separately since 2017, added 21,312 (+73.2%). These two groups alone added 78,043 students, more than offsetting the combined white and Black losses.
The result is not simply a Black-to-white story or even a white-to-Hispanic story. It is a shift from a two-group state to a genuinely multiethnic one. The Shannon diversity index, which measures how evenly enrollment is distributed across racial groups, rose from 1.019 to 1.281. South Carolina's student body in 2026 is measurably more pluralistic than at any point in the data.
The acceleration is real, but uneven
Year-over-year declines in white share were remarkably consistent from 2016 to 2019, hovering between -0.42 and -0.49 percentage points per year. Then COVID hit. In 2021, the drop doubled to -0.84 points, the largest single-year shift in the dataset. After a partial snapback in 2022 (-0.39 points), the rate climbed again: -0.61 in 2023, -0.60 in 2024, and -0.87 in 2025, the steepest year on record.
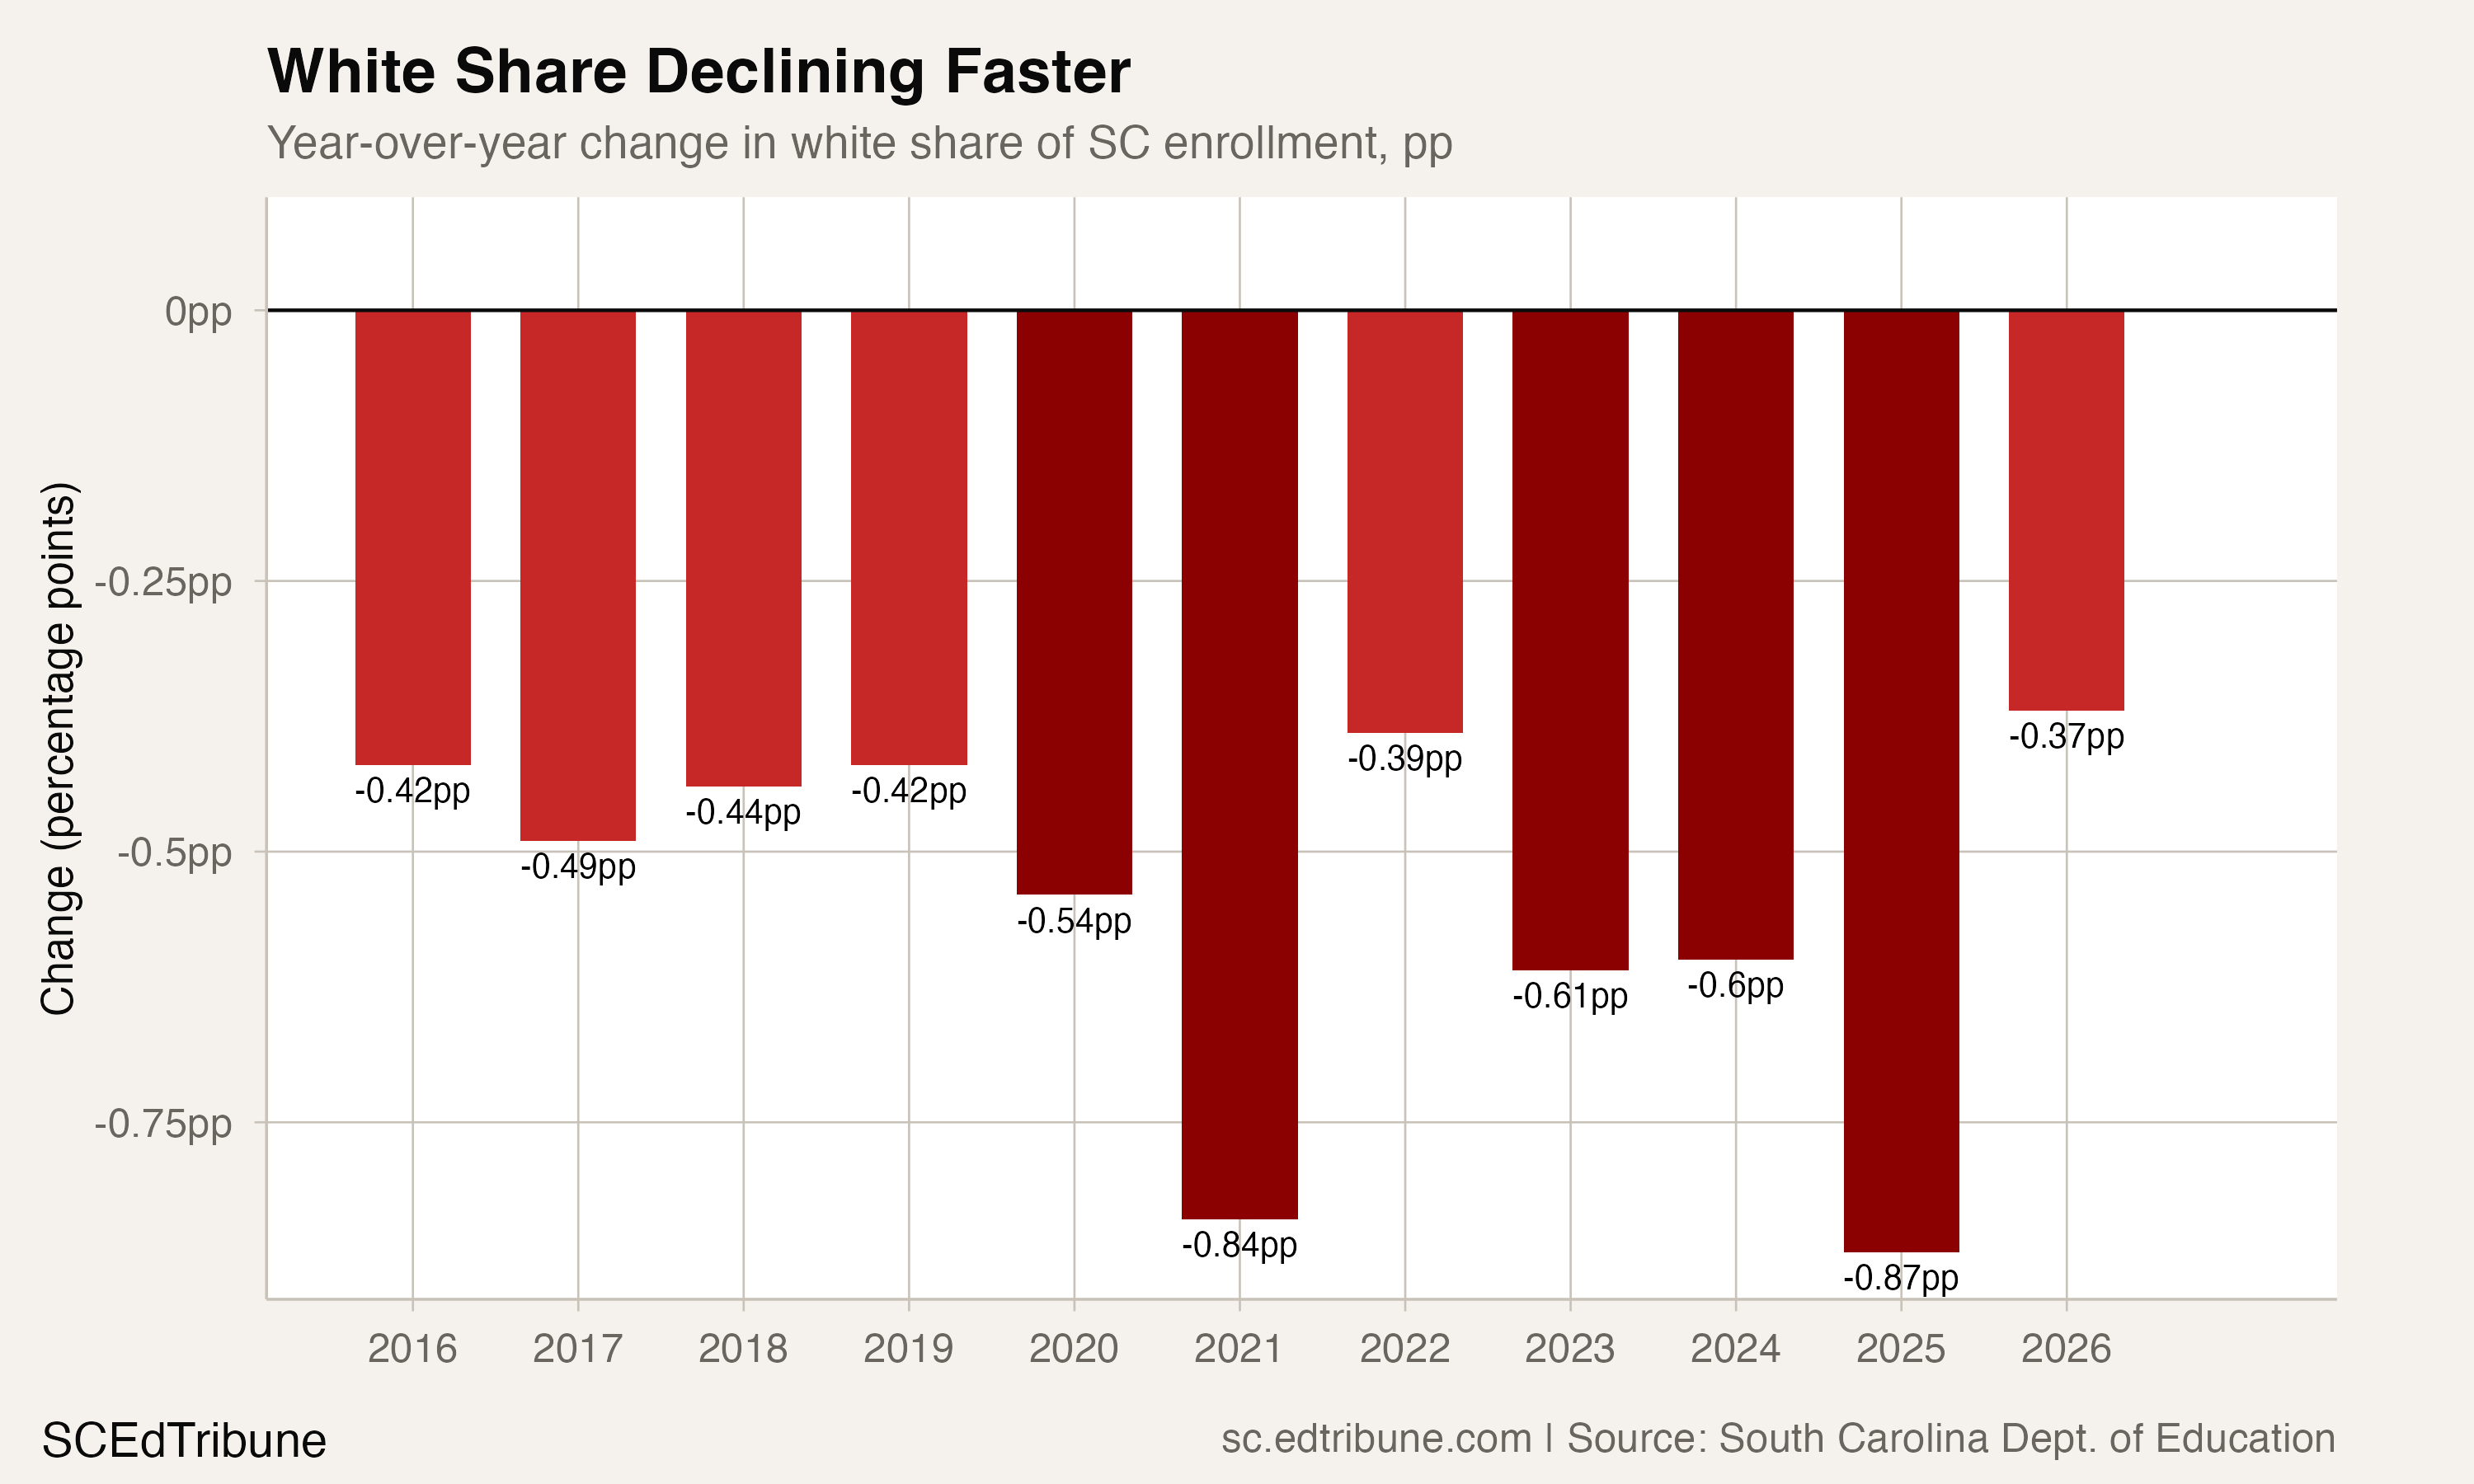
The 2026 figure, -0.37 points, looks like a deceleration, but this follows the record -0.87 drop in 2025. One moderated year does not break the trend: the post-2020 average decline is -0.61 points per year, compared to -0.46 points in the pre-COVID era. At the current pace, white share will fall below 40% before 2035.
What is driving the shift
Three forces are reshaping South Carolina's classrooms simultaneously.
The most visible is Hispanic population growth. South Carolina is the fastest-growing state in the country, adding nearly 80,000 residents between July 2024 and July 2025 alone, with 66,622 net domestic migrants. The state's Hispanic population grew to roughly 436,000 by mid-2024, about 8% of the total population. But Hispanic students are 14.8% of the school-age population, nearly double their share of the overall population, reflecting higher birth rates and younger household composition.
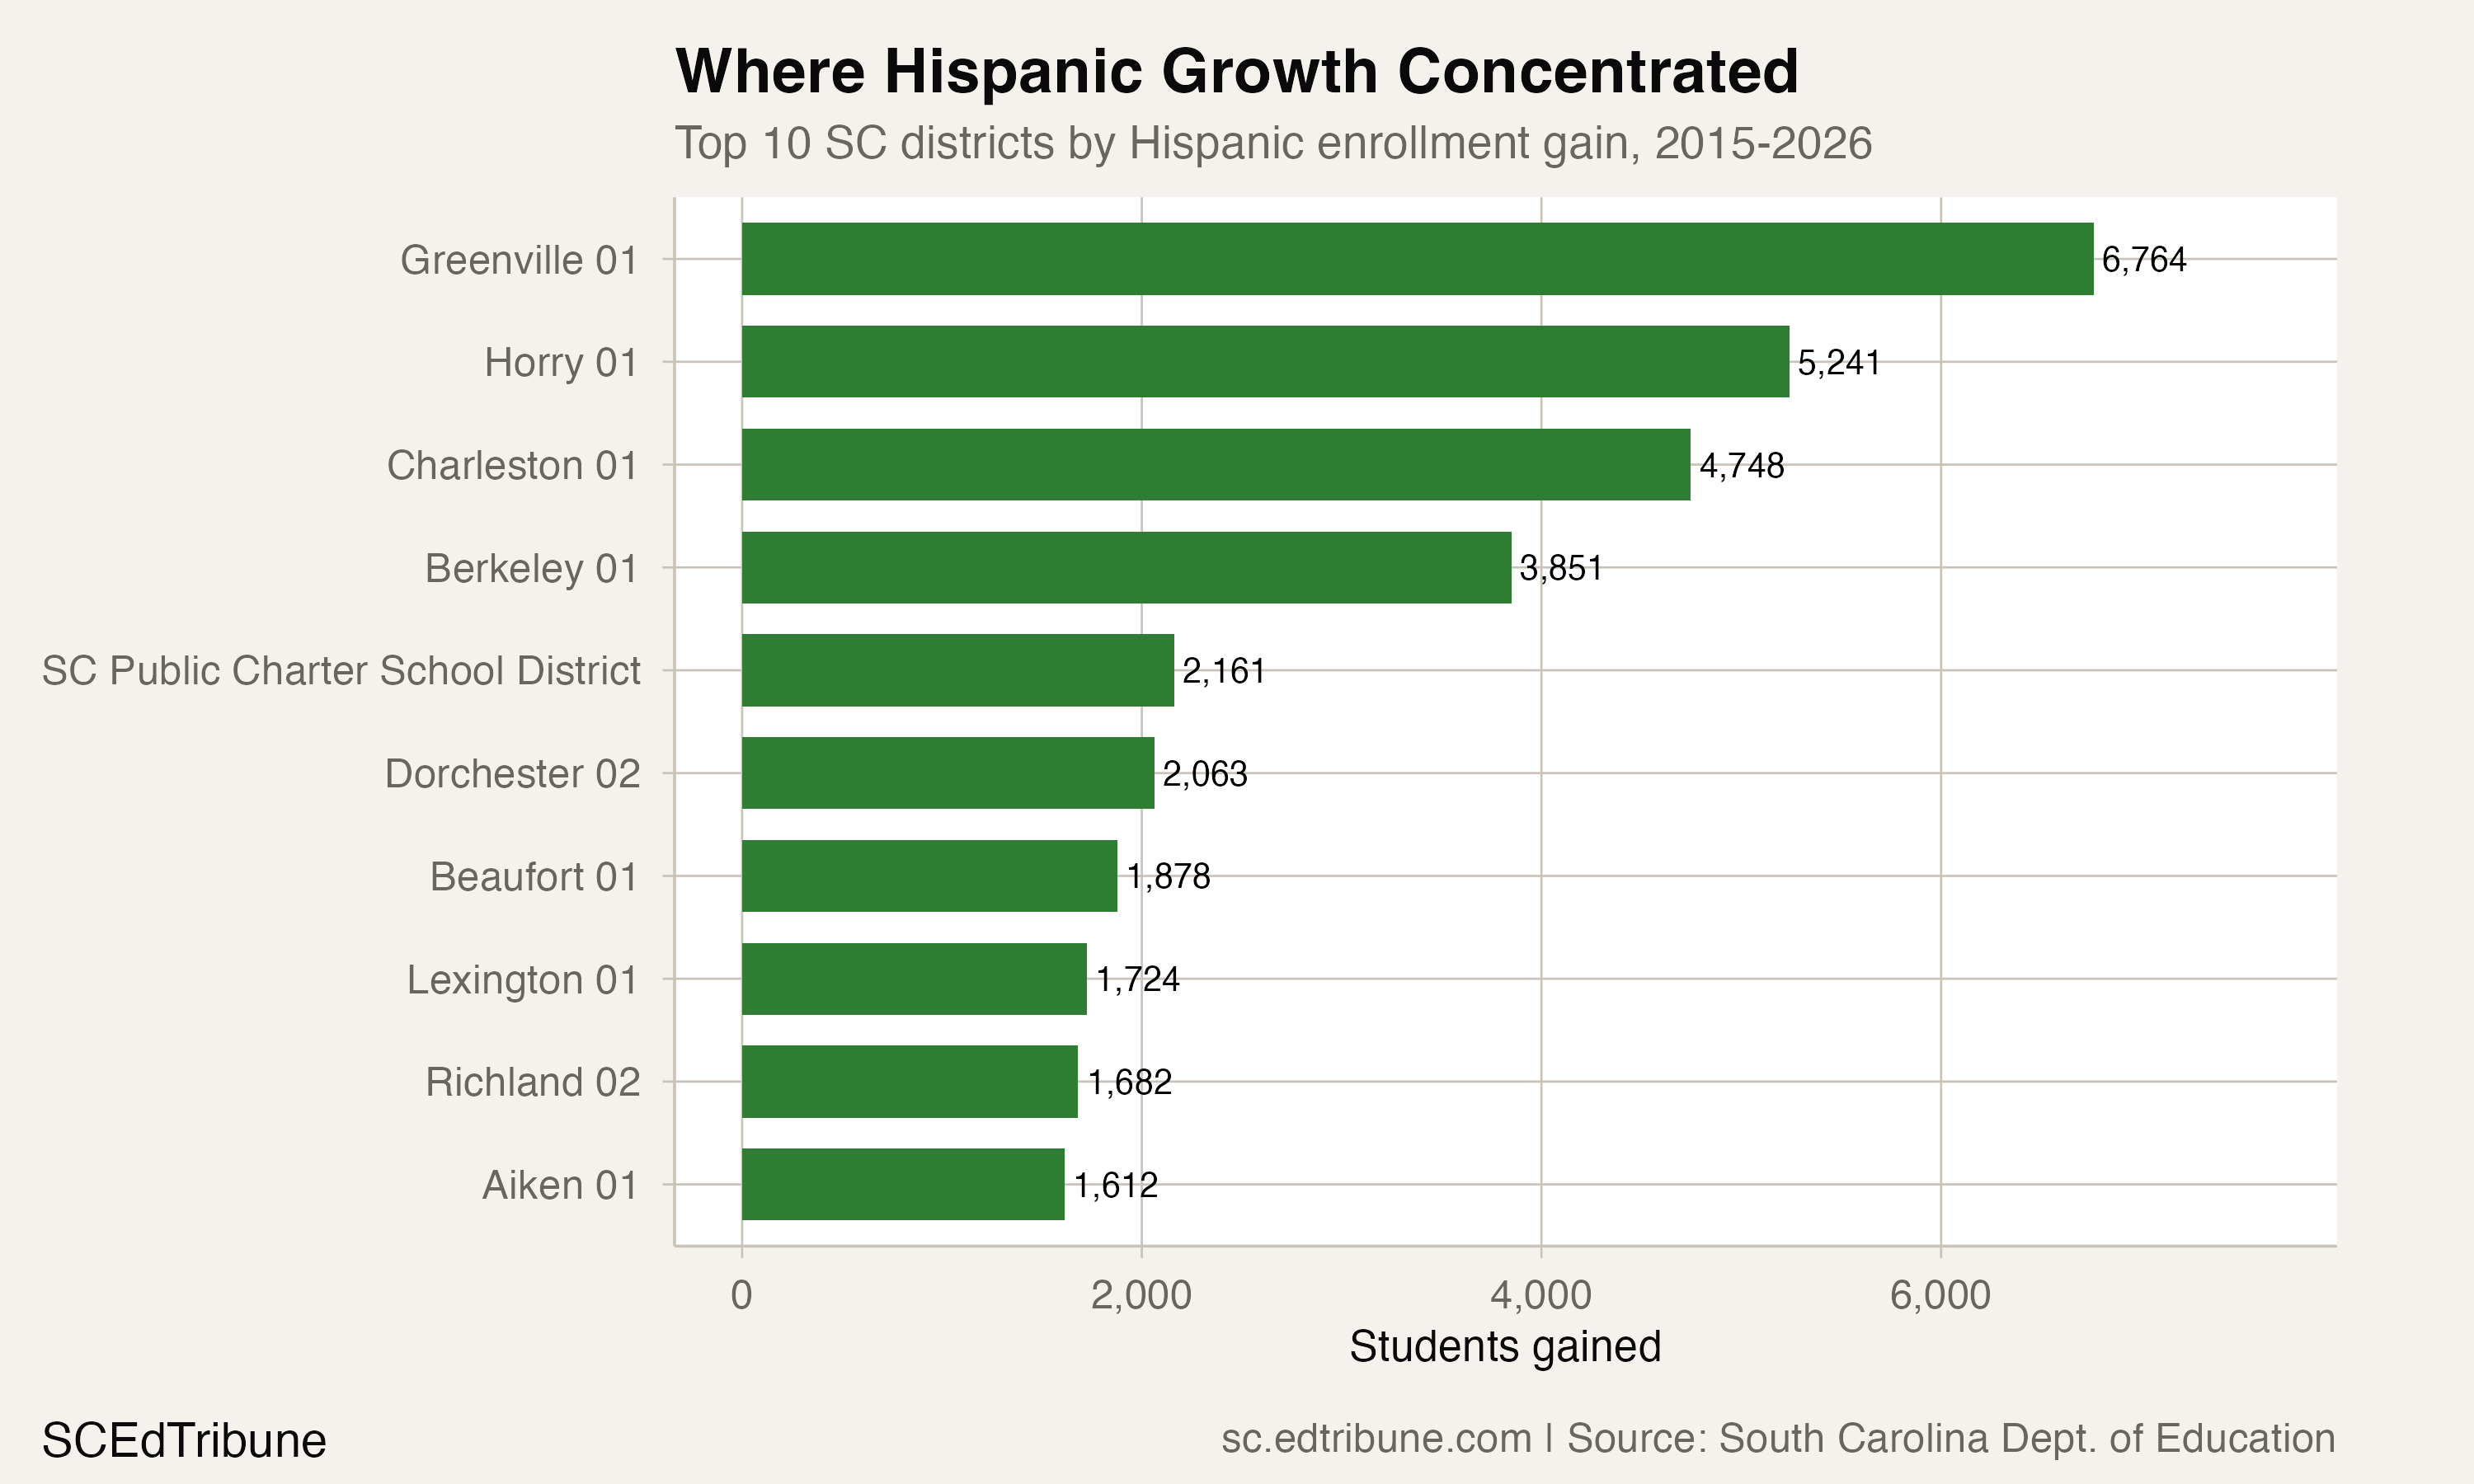
The growth is geographically concentrated. Greenville 01↗ET added 6,764 Hispanic students since 2015, more than any other district. Horry 01↗ET added 5,241, Charleston 01↗ET added 4,748, and Berkeley 01↗ET added 3,851. These four coastal and Upstate districts account for more than a third of the statewide Hispanic gain.
But growth is also reshaping rural districts. Jasper 01↗ET is now 58.4% Hispanic. Saluda 01 is 48.0%. Beaufort 01↗ET is 33.2%. In these communities, the classroom demographic arrived ahead of the political infrastructure to support it.
The second force is multiracial identification. The 73.2% surge in multiracial students since 2017 partly reflects families choosing the "two or more races" category who previously selected a single race. Federal reporting standards changed in 2010 to allow multiracial identification, and adoption has increased steadily since. Some of this growth represents genuine demographic change through interracial families; some is a reclassification of students who already existed in the system. The data cannot distinguish between the two.
The third force is Black enrollment decline. Black students dropped from 36.7% to 30.0% of enrollment, a loss of 41,256 students. This decline exceeds the white loss in absolute terms and far exceeds it in percentage terms (-14.9% vs. -7.8%). The mechanisms here are less clear. South Carolina's overall population is growing, not shrinking. One contributing factor may be the growth of school choice. The state's Education Scholarship Trust Fund awarded all 10,000 ESA scholarships worth $7,500 each for 2025-26, with the cap rising to 15,000 for 2026-27. Declining birth rates among Black families nationally offer suggestive context, but no South Carolina-specific research directly links demographic change to this enrollment pattern.
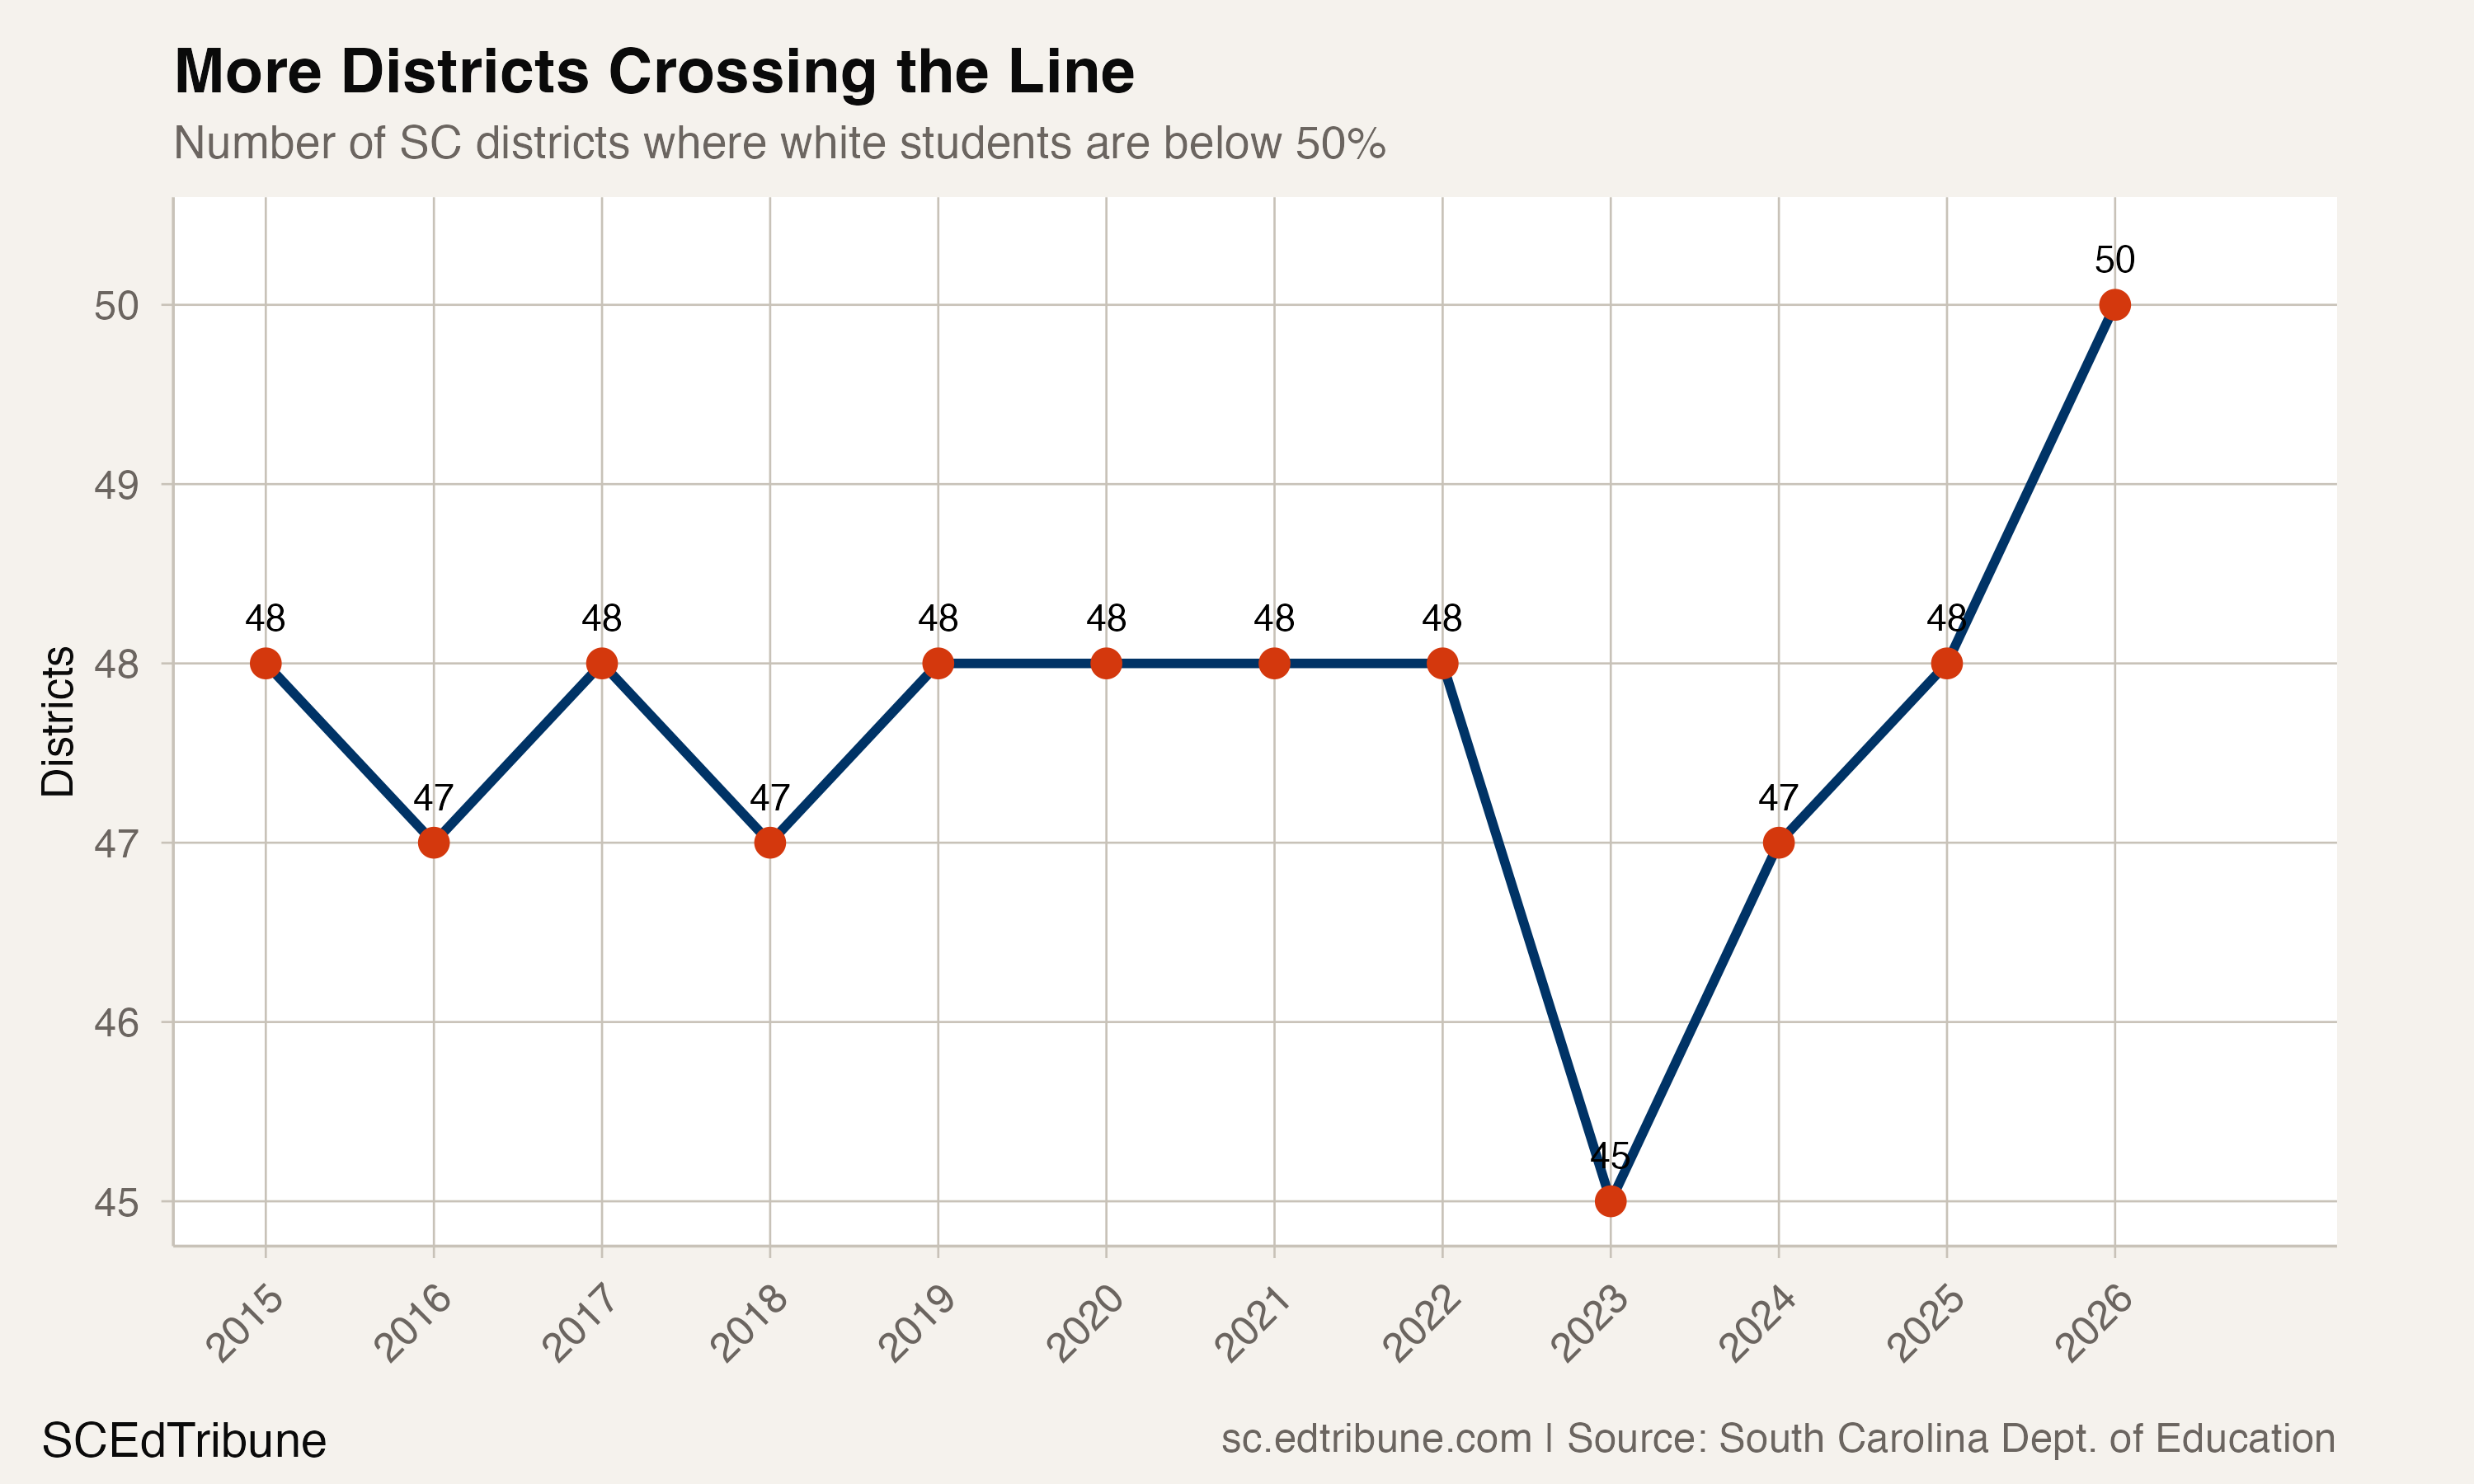
11 districts crossed the line
In 2015, 48 of South Carolina's 89 districts were majority-minority. By 2026, 50 of 81 districts are. The raw count has not moved much, but the composition has: 11 districts that were white-majority in 2015 have crossed to majority-minority.
The largest flips are instructive. Lexington 04↗ET saw its white share fall from 66.2% to 45.8%, a 20.4-point drop, driven heavily by Hispanic growth (26.9% Hispanic share in 2026). Aiken 01↗ET dropped from 53.4% to 42.0%. Anderson 05↗ET went from 54.7% to 44.2%. Greenville 01↗ET, the state's largest district, crossed below 50% on its way from 56.5% to 47.4%. Dorchester 02↗ET and Berkeley 01↗ET both flipped, part of the broader Charleston metro transformation.
These are not urban-core districts. They are suburban and exurban communities in the state's growth corridors. The demographic shift is no longer confined to historically majority-Black rural districts. It is arriving in the districts where white families have been moving.
What this means for schools
A state where no racial group holds a majority faces a different kind of operational challenge than one where a single group dominates. Bilingual education staffing, for example, is calibrated to a population that has nearly doubled in 12 years. Districts where Hispanic enrollment was 5% in 2015 and is 20% in 2026 have had to build language programs from scratch.
The fiscal question is equally pressing. South Carolina's school funding formula distributes weighted pupil allocations that adjust for student characteristics. A student body that is growing more diverse in linguistic background and shrinking in its historically largest groups creates a mismatch between the districts experiencing the most rapid change and the ones with the institutional capacity to absorb it.
For Black enrollment, the 14.9% decline poses a separate set of questions. The state's Birth-to-Five data shows that 26.7% of births are to Black mothers, compared to 30.0% of current enrollment. The pipeline is narrowing. Whether this reflects families choosing private options, leaving the state, or declining birth rates is not yet clear from enrollment data alone.
South Carolina did not reach a demographic plateau after crossing below 50% white in 2019. It accelerated past it. Every district in the state will get more diverse. The only variable is how soon.
Detailed code that reproduces the analysis and figures in this article is available exclusively to EdTribune subscribers.
Discussion
Sign in to join the discussion.
Loading comments...