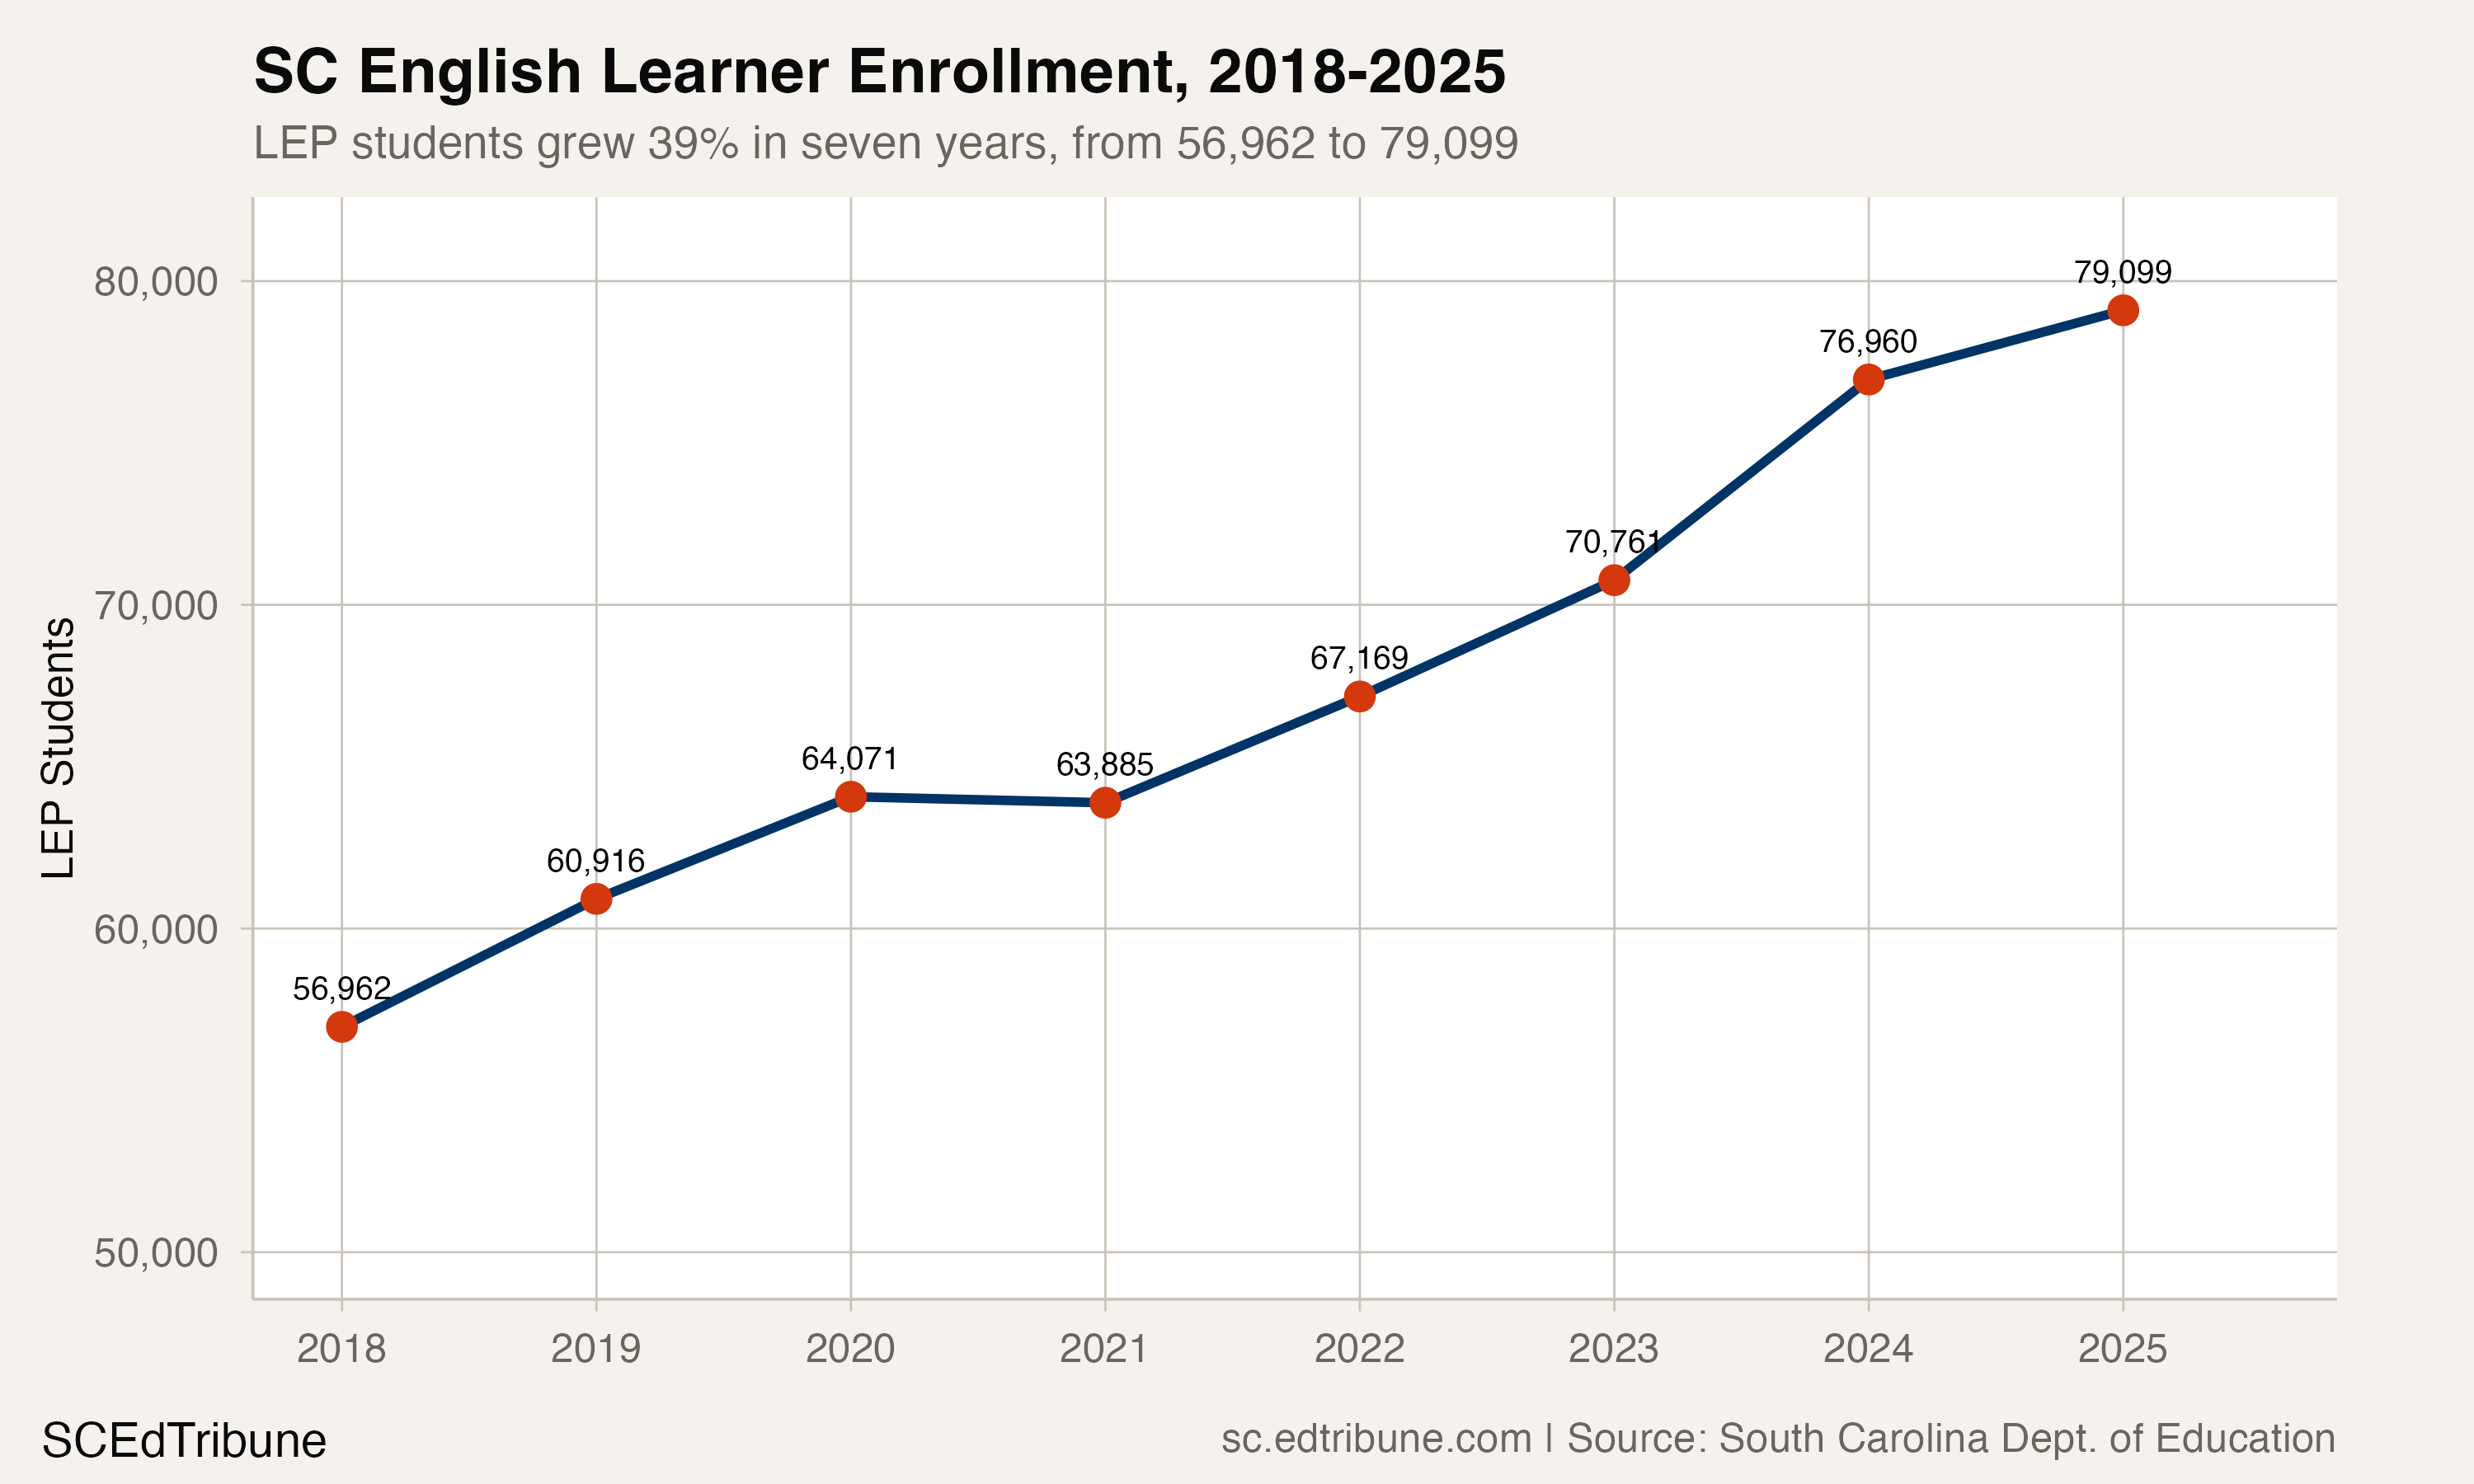
Seven years ago, roughly one in 14 South Carolina public school students was classified as Limited English Proficient. By 2024-25, the ratio had crossed one in 10. The state added 22,137 students to the LEP rolls between 2017-18 and 2024-25, a 38.9% increase, while total enrollment grew just 2.3% over the same period. That means LEP growth outpaced the overall student body by a factor of nearly 17.
The surge is not evenly distributed. In Jasper 01↗ET, nearly half the student body, 45.1%, is classified LEP. In Saluda 01↗ET, a rural Midlands district of 2,500 students, the rate is 35.4%. These are not urban school systems with large bilingual staffing pipelines. They are small, rural districts absorbing a transformation in student need with limited capacity to respond.
The trajectory: steady, then a spike, then a question
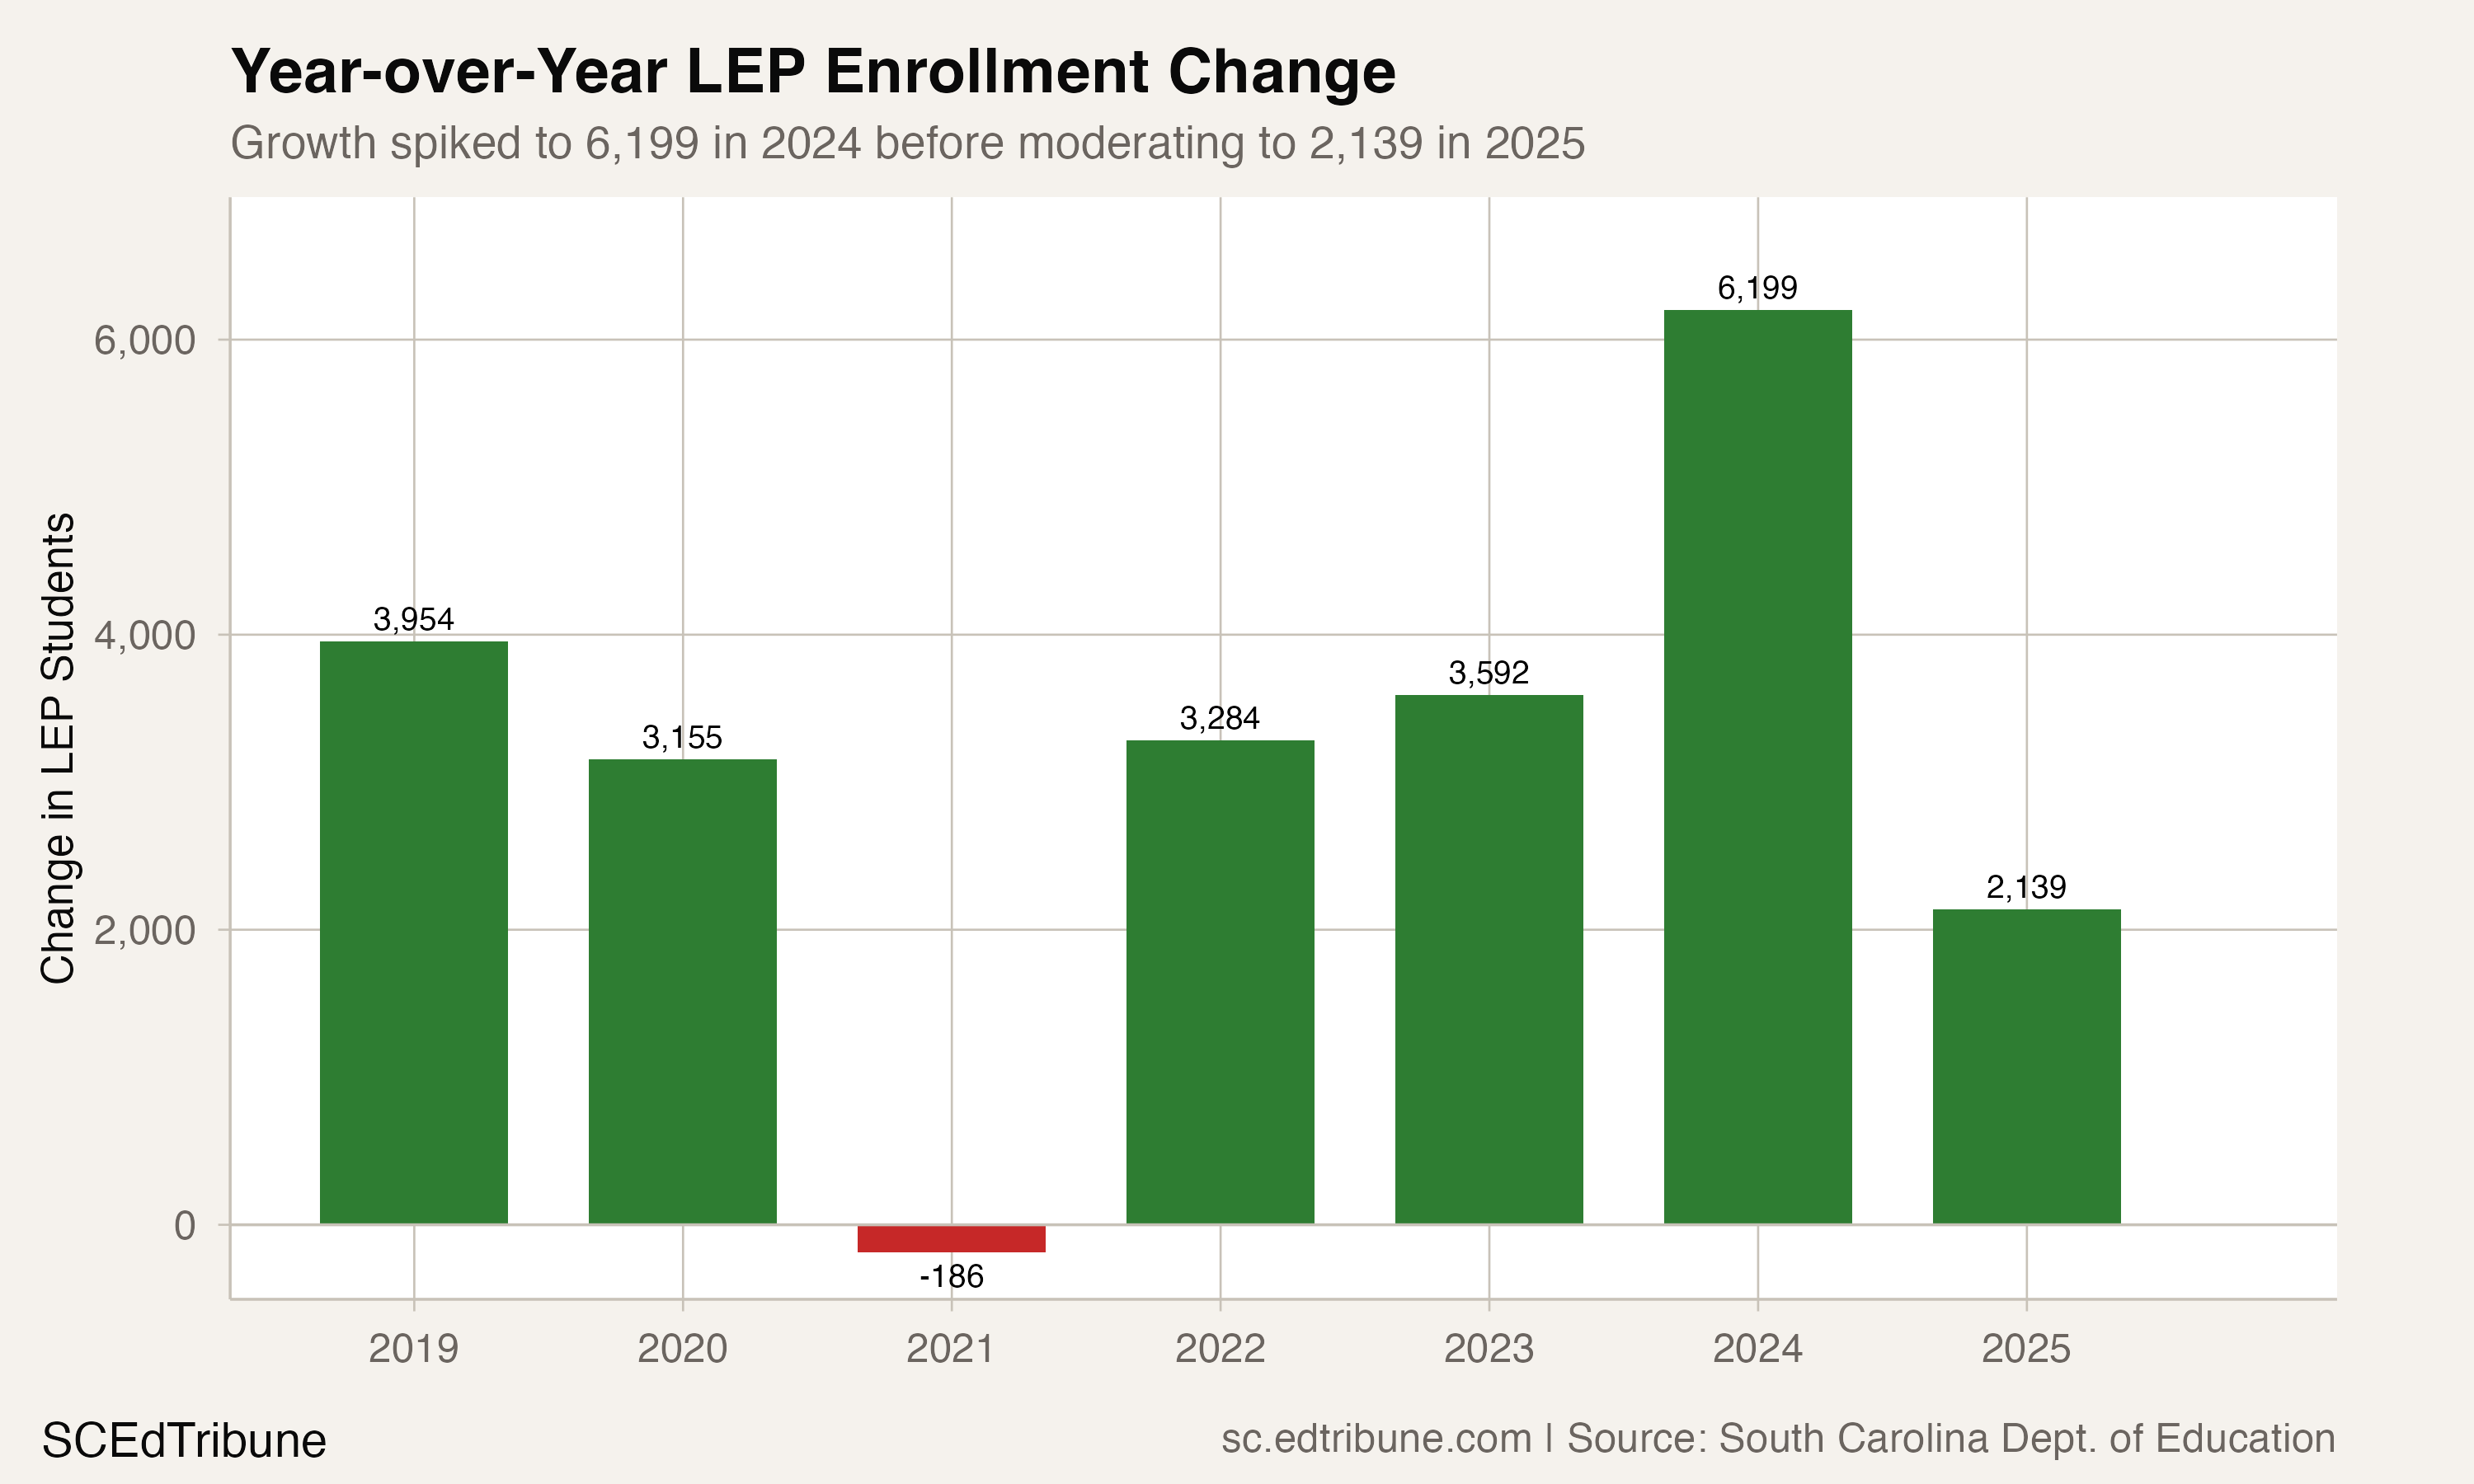
South Carolina's LEP population grew at a remarkably consistent pace from 2018 to 2023, adding between roughly 3,100 and 4,000 students each year. The only interruption was a negligible dip of 186 during the first COVID year (2020-21), far smaller than the 20,250-student hit to overall enrollment. Students learning English, in other words, barely flinched during the pandemic.
Then 2023-24 happened. The state added 6,199 students to the LEP rolls in a single year, an 8.8% jump that nearly doubled the prior pace. The 2024-25 year moderated to 2,139 newly classified LEP students, the smallest annual gain since 2020. Whether that moderation reflects a genuine plateau or a temporary pause is one of the open questions in South Carolina education data right now.
| Year | LEP Students | Change | LEP Share |
|---|---|---|---|
| 2017-18 | 56,962 | -- | 7.3% |
| 2018-19 | 60,916 | +3,954 | 7.8% |
| 2019-20 | 64,071 | +3,155 | 8.1% |
| 2020-21 | 63,885 | -186 | 8.3% |
| 2021-22 | 67,169 | +3,284 | 8.6% |
| 2022-23 | 70,761 | +3,592 | 9.0% |
| 2023-24 | 76,960 | +6,199 | 9.7% |
| 2024-25 | 79,099 | +2,139 | 9.9% |
Note that LEP share climbed even in 2020-21, when LEP headcount dipped slightly. That is because total enrollment fell much harder: the denominator shrank faster than the numerator.
Two forces, tightly linked
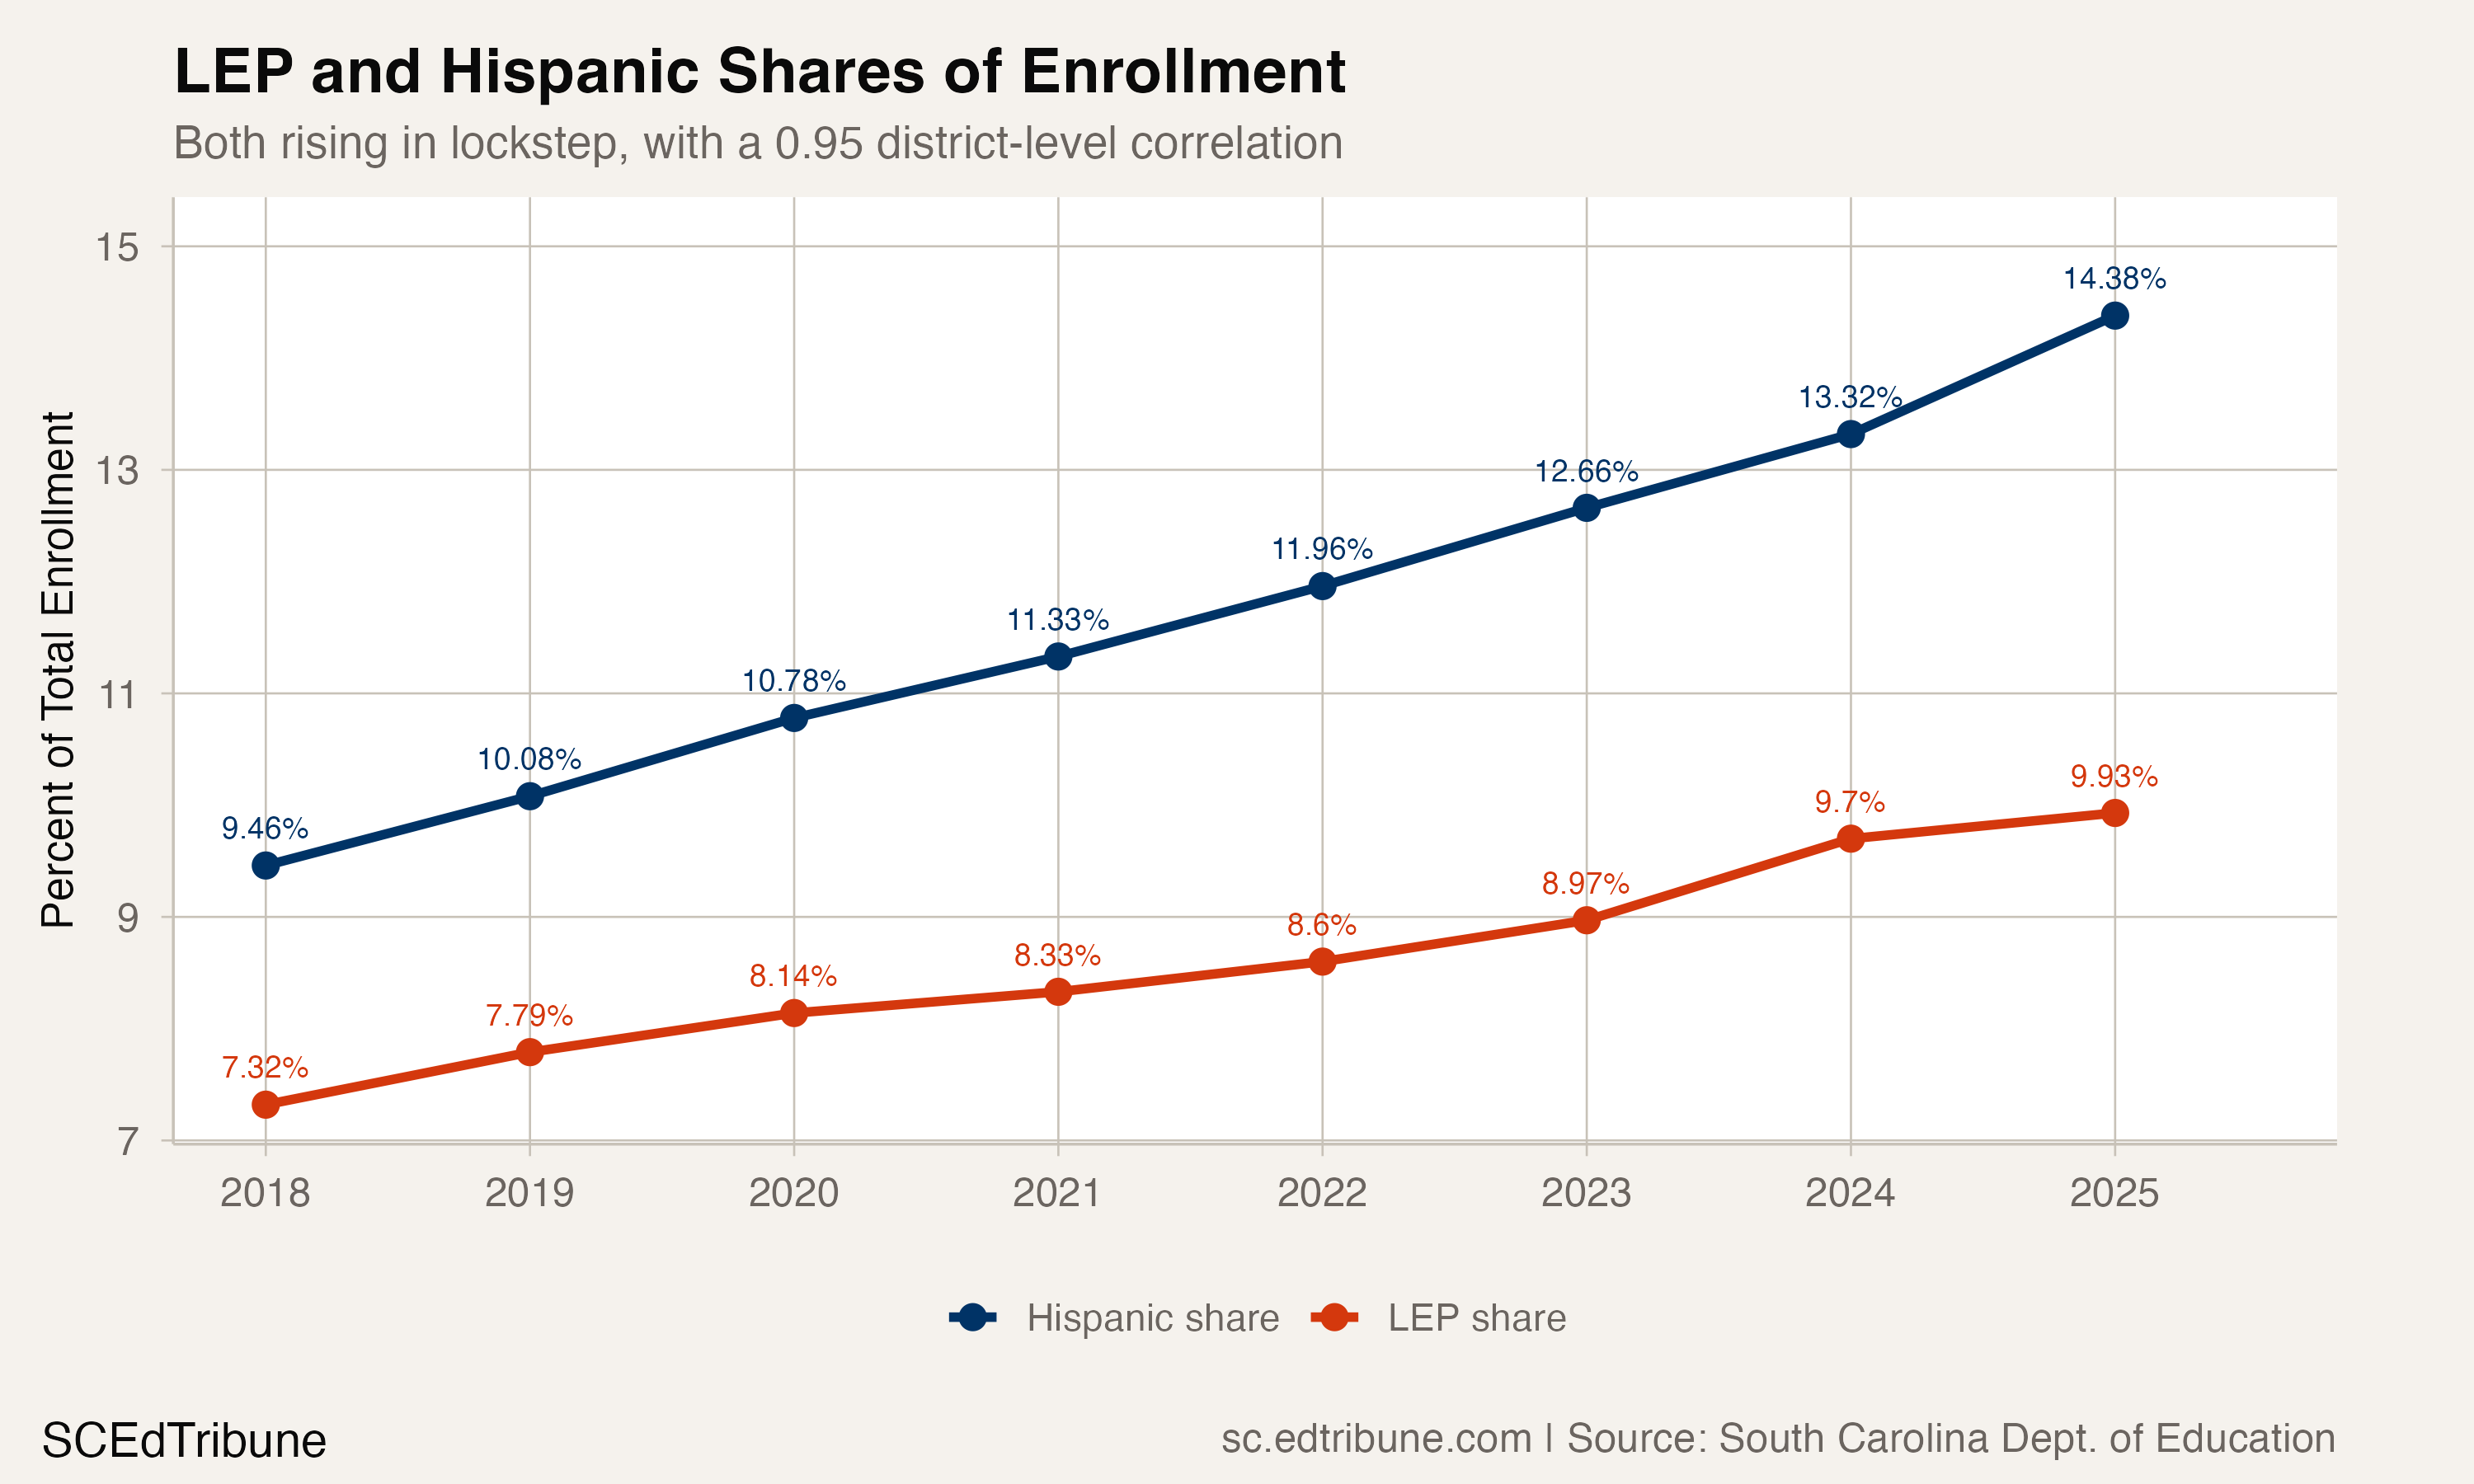
The LEP surge tracks almost perfectly with South Carolina's Hispanic enrollment growth. At the district level, the correlation between a district's LEP rate and its Hispanic share is 0.95, about as tight as demographic relationships get.
Hispanic enrollment rose 55.6% over the same period, from 73,653 to 114,594 students. Both groups are climbing, but they are not the same population: students classified LEP made up 77.3% of Hispanic enrollment in 2018 and 69.0% in 2025. The gap is growing, which means more Hispanic students are arriving (or being born into families) with English proficiency, even as the absolute number of students who need English language services continues to rise.
Separating new arrivals from newly identified students is not possible with this data. Some portion of the LEP increase reflects students who were already enrolled but were reclassified as LEP under updated screening protocols. The South Carolina Department of Education updated proficiency codes and guidance for the Multilingual Learner Program during this period. Without student-level panel data, the split between identification-driven growth and arrival-driven growth remains unknown.
Where the growth concentrates
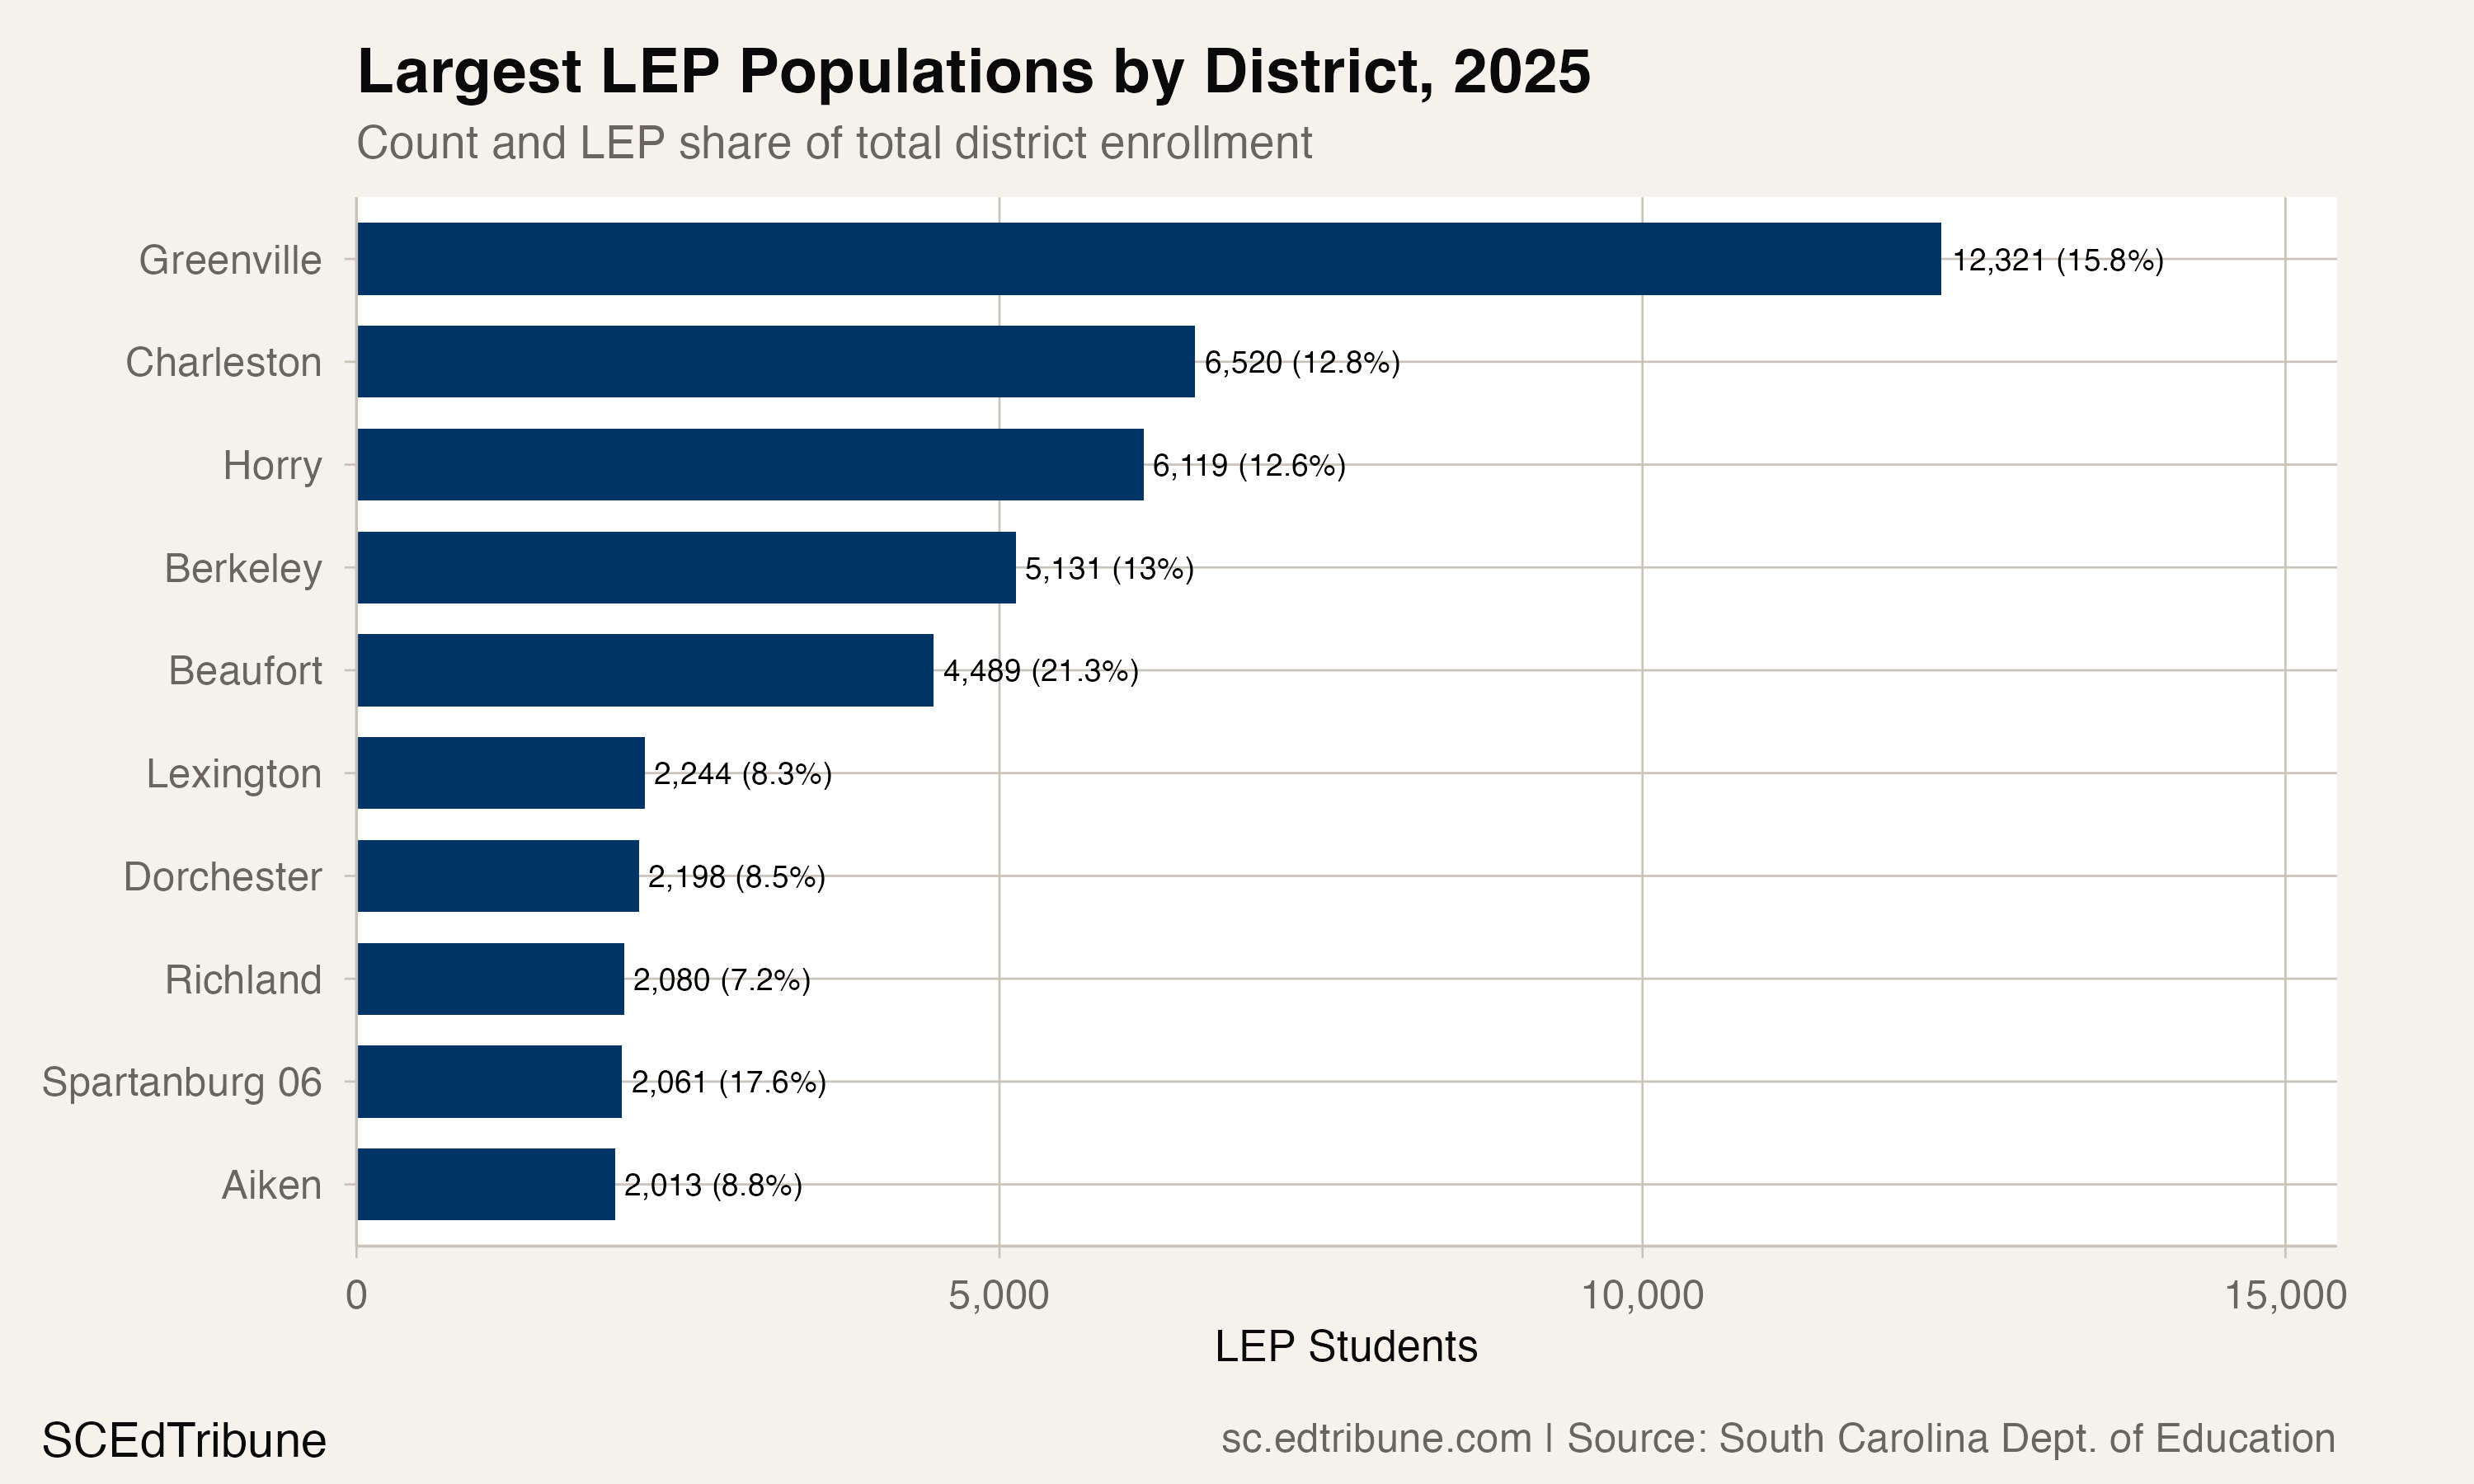
Greenville 01↗ET has the largest LEP population in the state at 12,321 students, 15.8% of its enrollment. But in absolute terms, Charleston 01↗ET added the most students learning English since 2018: 2,691, a 70.3% increase that brought its LEP count to 6,520. Berkeley 01↗ET added 2,102 (+69.4%), and Horry 01↗ET added 1,814 (+42.1%).
The coastal corridor from Myrtle Beach to the Lowcountry accounts for much of the growth, consistent with South Carolina's broader population surge. Horry County grew 3.8% in population in 2024 alone, ranking 34th nationally. Berkeley County grew 3.2%. Jasper County, home to the state's highest LEP rate, was the third-fastest-growing county in the nation at 5.9%.
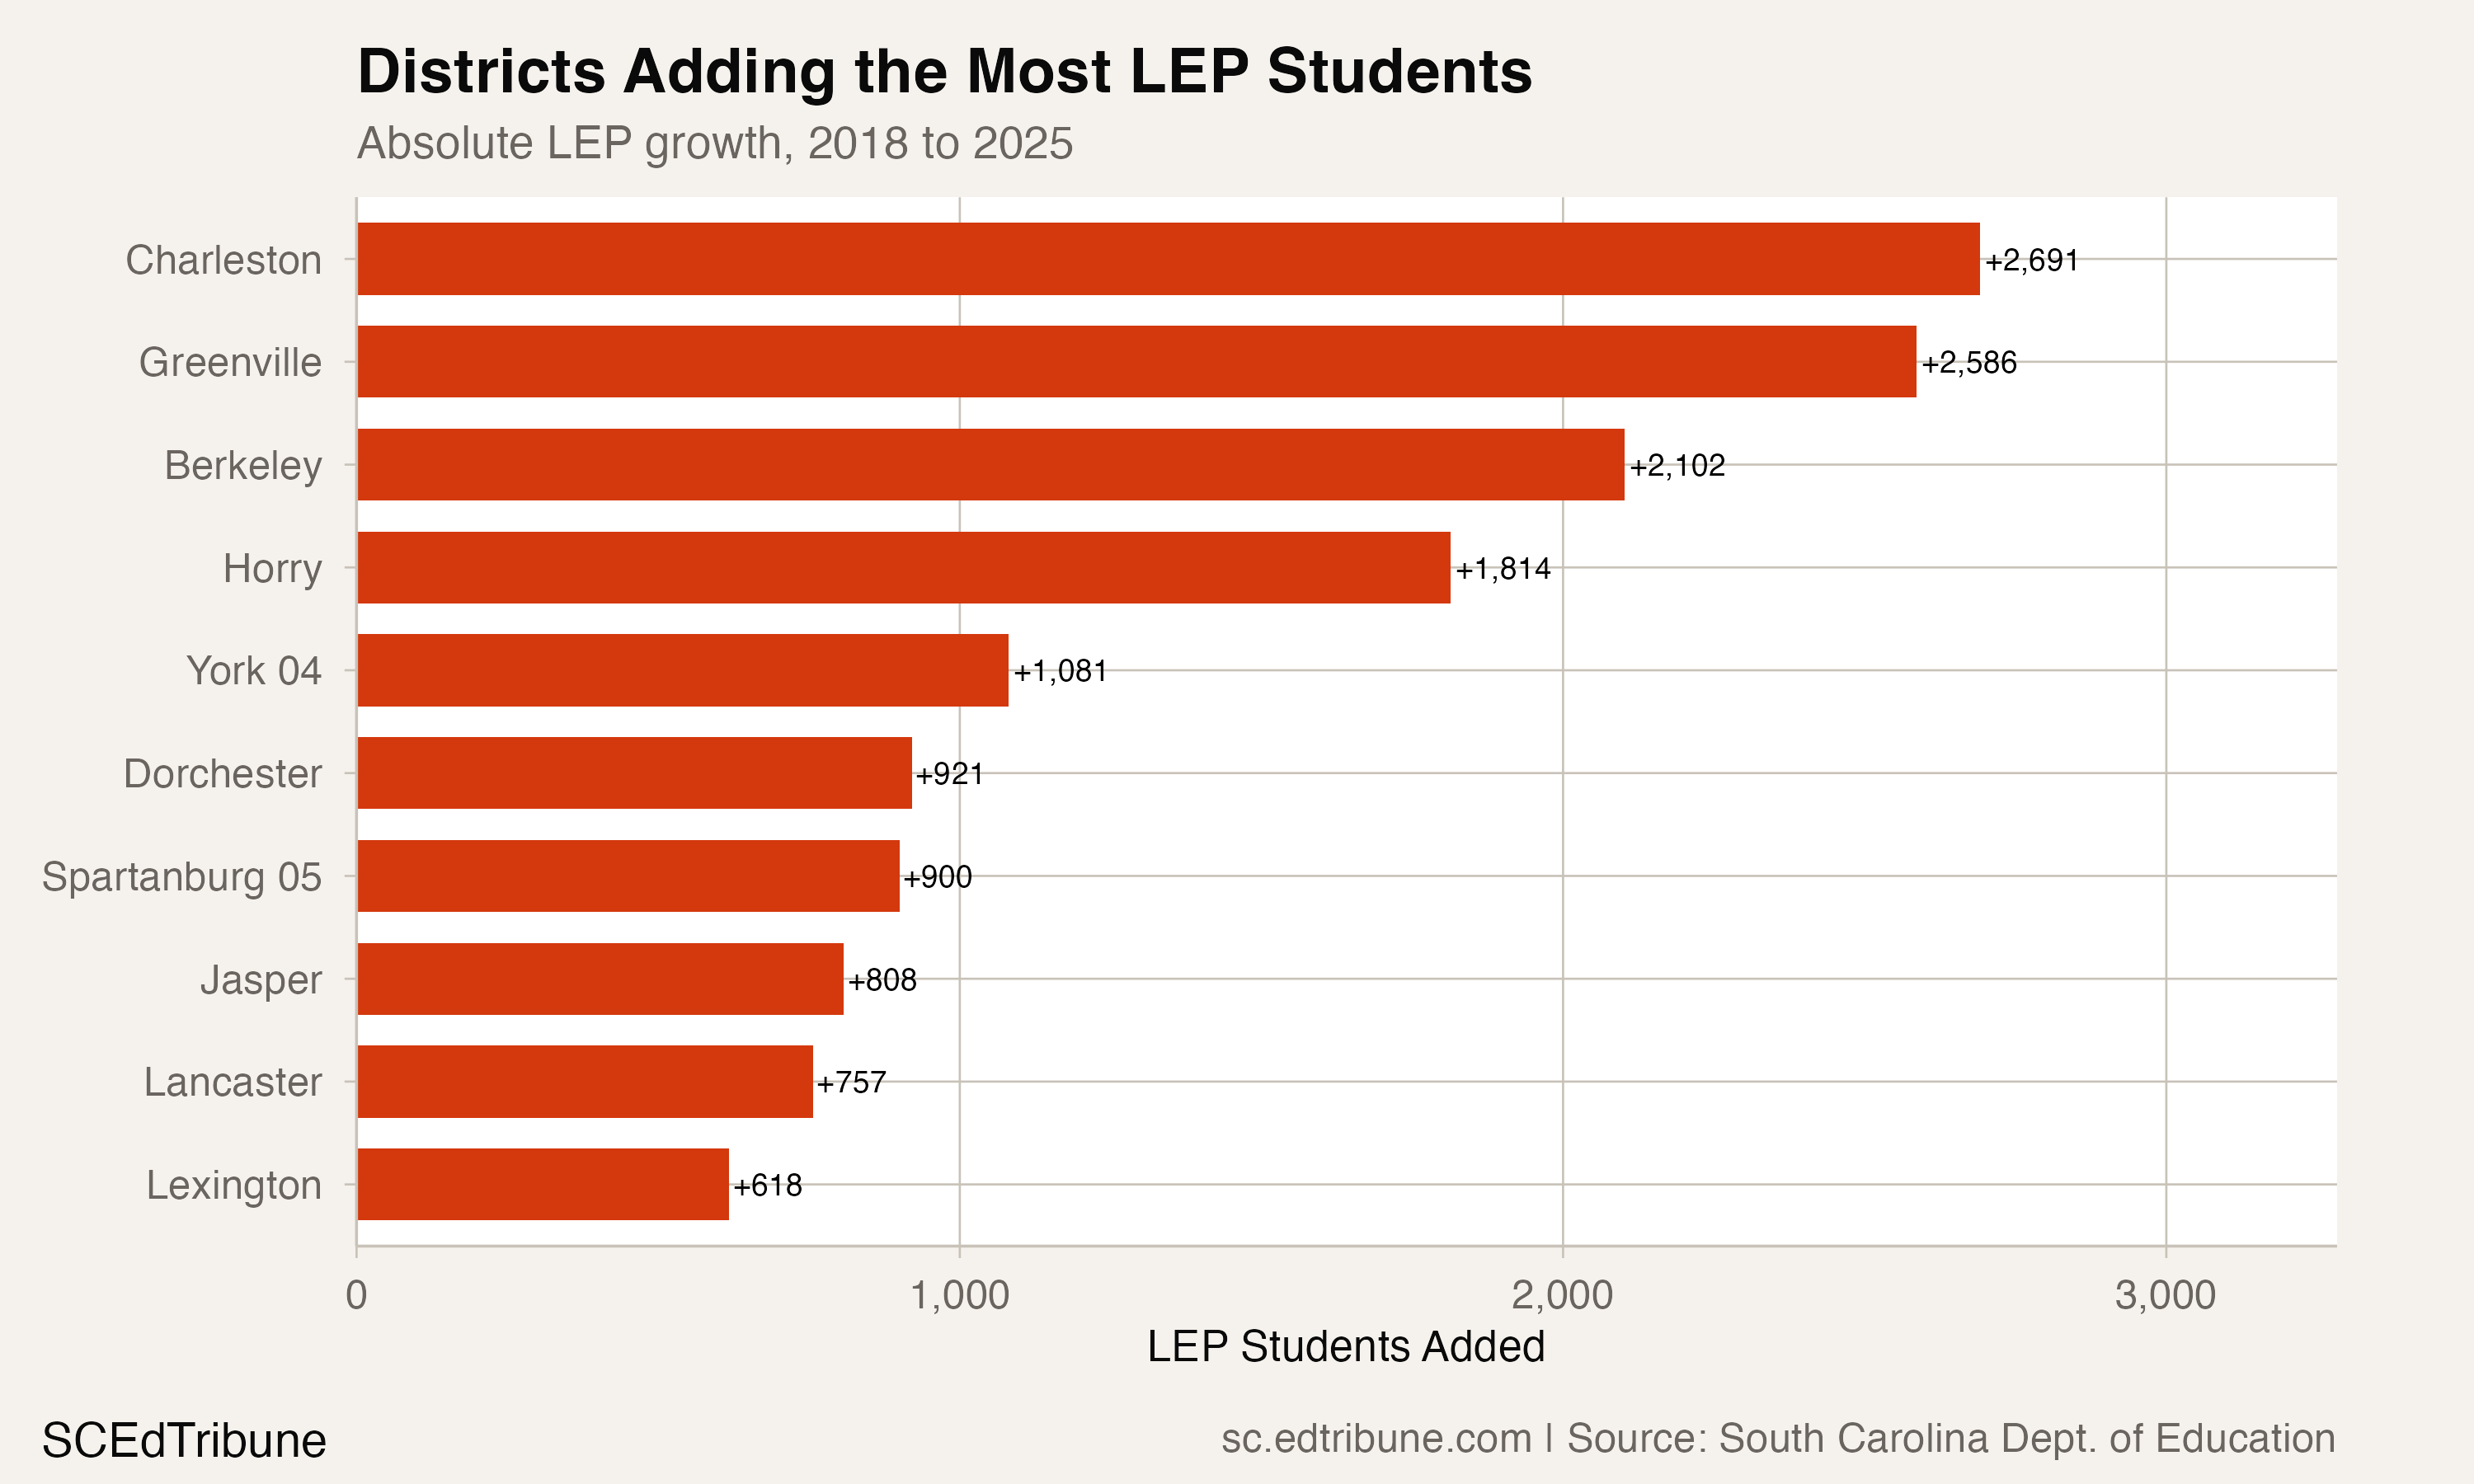
But the growth extends well beyond the coast. Spartanburg 05↗ET in the Upstate added 900 students learning English (+128.9%), and York 04↗ET near Charlotte added 1,081 (+119.1%). Lexington 02↗ET in the Midlands now has a 22.1% LEP rate. The pattern suggests a statewide labor market dynamic, with construction, agriculture, and service industries drawing families across every region.
The staffing gap that follows the students
South Carolina has designated ESOL as a critical need subject area for 2025-26 teacher recruitment. The state's START report, released in March 2025, acknowledged that no single policy can fully reverse ongoing educator shortages and called for expanded apprenticeship pathways and innovative certification models.
The scale of the mismatch is visible at the district level. Horry County Schools, which serves over 6,100 students classified LEP across five primary languages, has been adding ESOL teachers since at least 2016, when its multilingual population was a fraction of its current size. Charleston County's multilingual learner population grew from roughly 1,560 in 2006 to over 8,000 by the start of 2024-25, spanning five primary languages led by Spanish, Portuguese, and Russian. Yahisa De Leon, the district's newcomer program director, described the reality for students arriving with no English and no local connections:
"When they come in here, they feel lost and they're alone." -- Live 5 News, Feb. 2026
The minimum starting teacher salary in South Carolina rose from $47,000 in 2024-25 to $48,500 in 2025-26, still short of the state's stated $50,000 goal, but higher base pay alone does not produce bilingual teachers.
The 2024-25 school year began with 1,043 teacher vacancies statewide, down from 1,613 the prior year. The state does not publish vacancy data by subject area, making it impossible to know how many of those openings were for ESOL positions specifically.
What the 2024 spike means, and what it does not
The 6,199-student jump in 2023-24 deserves scrutiny. It was nearly double the typical annual increase and came alongside a broader year of strong population growth in the state. Two plausible explanations compete.
The first is arrival-driven: South Carolina's population grew by 91,000 residents from mid-2023 to mid-2024, overwhelmingly through domestic migration. The state's Hispanic population reached an estimated 436,000 by July 2024, up from 351,557 in the 2020 Census. If the LEP spike reflects actual new students enrolling in South Carolina schools for the first time, it is consistent with one of the fastest-growing states in the country adding families at an accelerating rate.
The second is identification-driven: the state's Multilingual Learner Program has updated its screening and classification guidance in recent years, and districts vary widely in how aggressively they screen new and continuing students. A district that adopts more thorough screening could reclassify hundreds of existing students as LEP in a single year without enrolling a single new family. The 2024-25 moderation to 2,139 newly classified LEP students could reflect either a real slowdown in arrivals or a return to baseline after a one-time screening catch-up.
The data cannot distinguish between these explanations. Both are likely operating simultaneously.
The 2026 gap
South Carolina's LEP data for 2025-26 is not yet available, leaving a gap at exactly the point when statewide enrollment dropped by 7,694 students. If the LEP population continued to grow while total enrollment fell, the LEP share would be approaching or exceeding 10%, meaning one in every 10 students in the state would need English language support services. That threshold carries operational weight: it changes the math on how many certified ESOL instructors a district needs, how Title III funds are allocated, and whether existing bilingual programs can absorb the demand.
In Jasper, 45% of students already need English language services. In Saluda, it is 35%. Those districts did not wait for a policy framework. They hired bilingual graduates, approved bond referenda, and built programs with whatever capacity they had. The enrollment data says more districts are headed in that direction. The staffing pipeline says most of them are not ready.
Detailed code that reproduces the analysis and figures in this article is available exclusively to EdTribune subscribers.
Discussion
Sign in to join the discussion.
Loading comments...