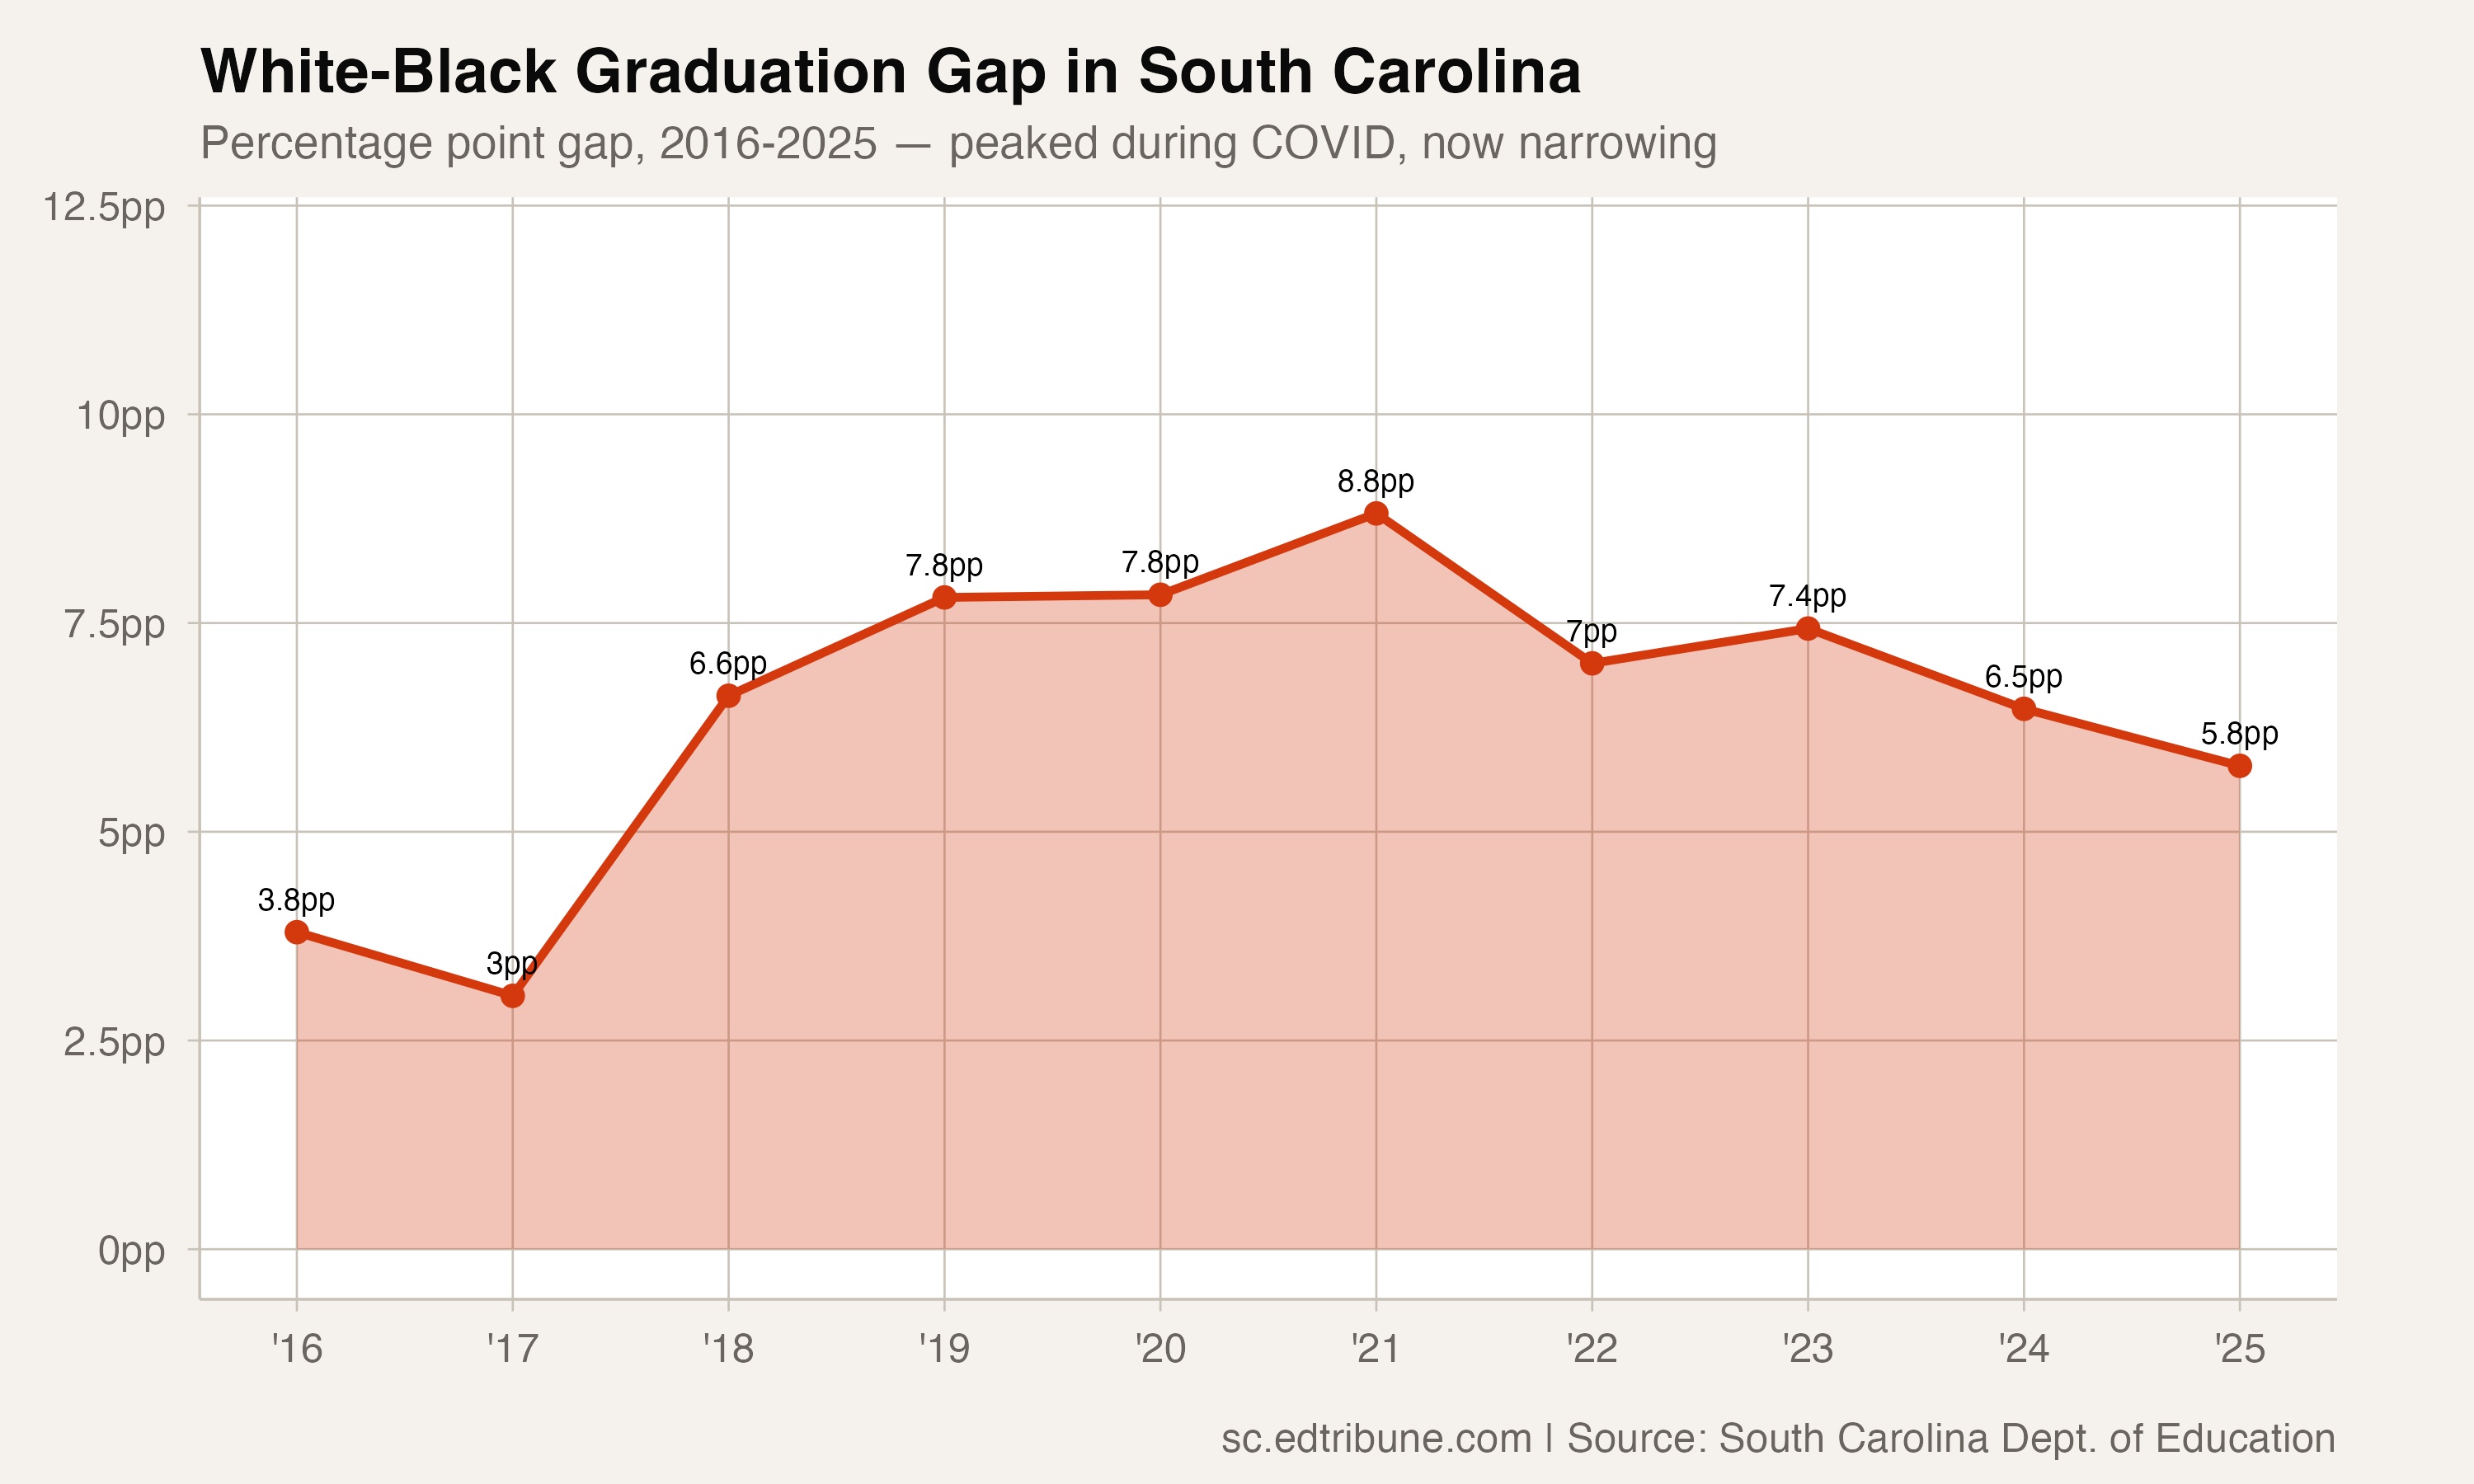
Black students in South Carolina graduated at 83.5% in 2025, the highest rate the state has recorded for the subgroup, up from 78.1% four years earlier. That 5.4-point four-year gain has driven the white-Black graduation gap down from a COVID-era peak of 8.8 percentage points to 5.8.
Black students gained ground twice as fast as white students over the same period. From 2021 to 2025, the Black rate rose 5.4 points while the white rate climbed 2.4. The result: a 3-point narrowing of the gap in four years.
The gap's two eras
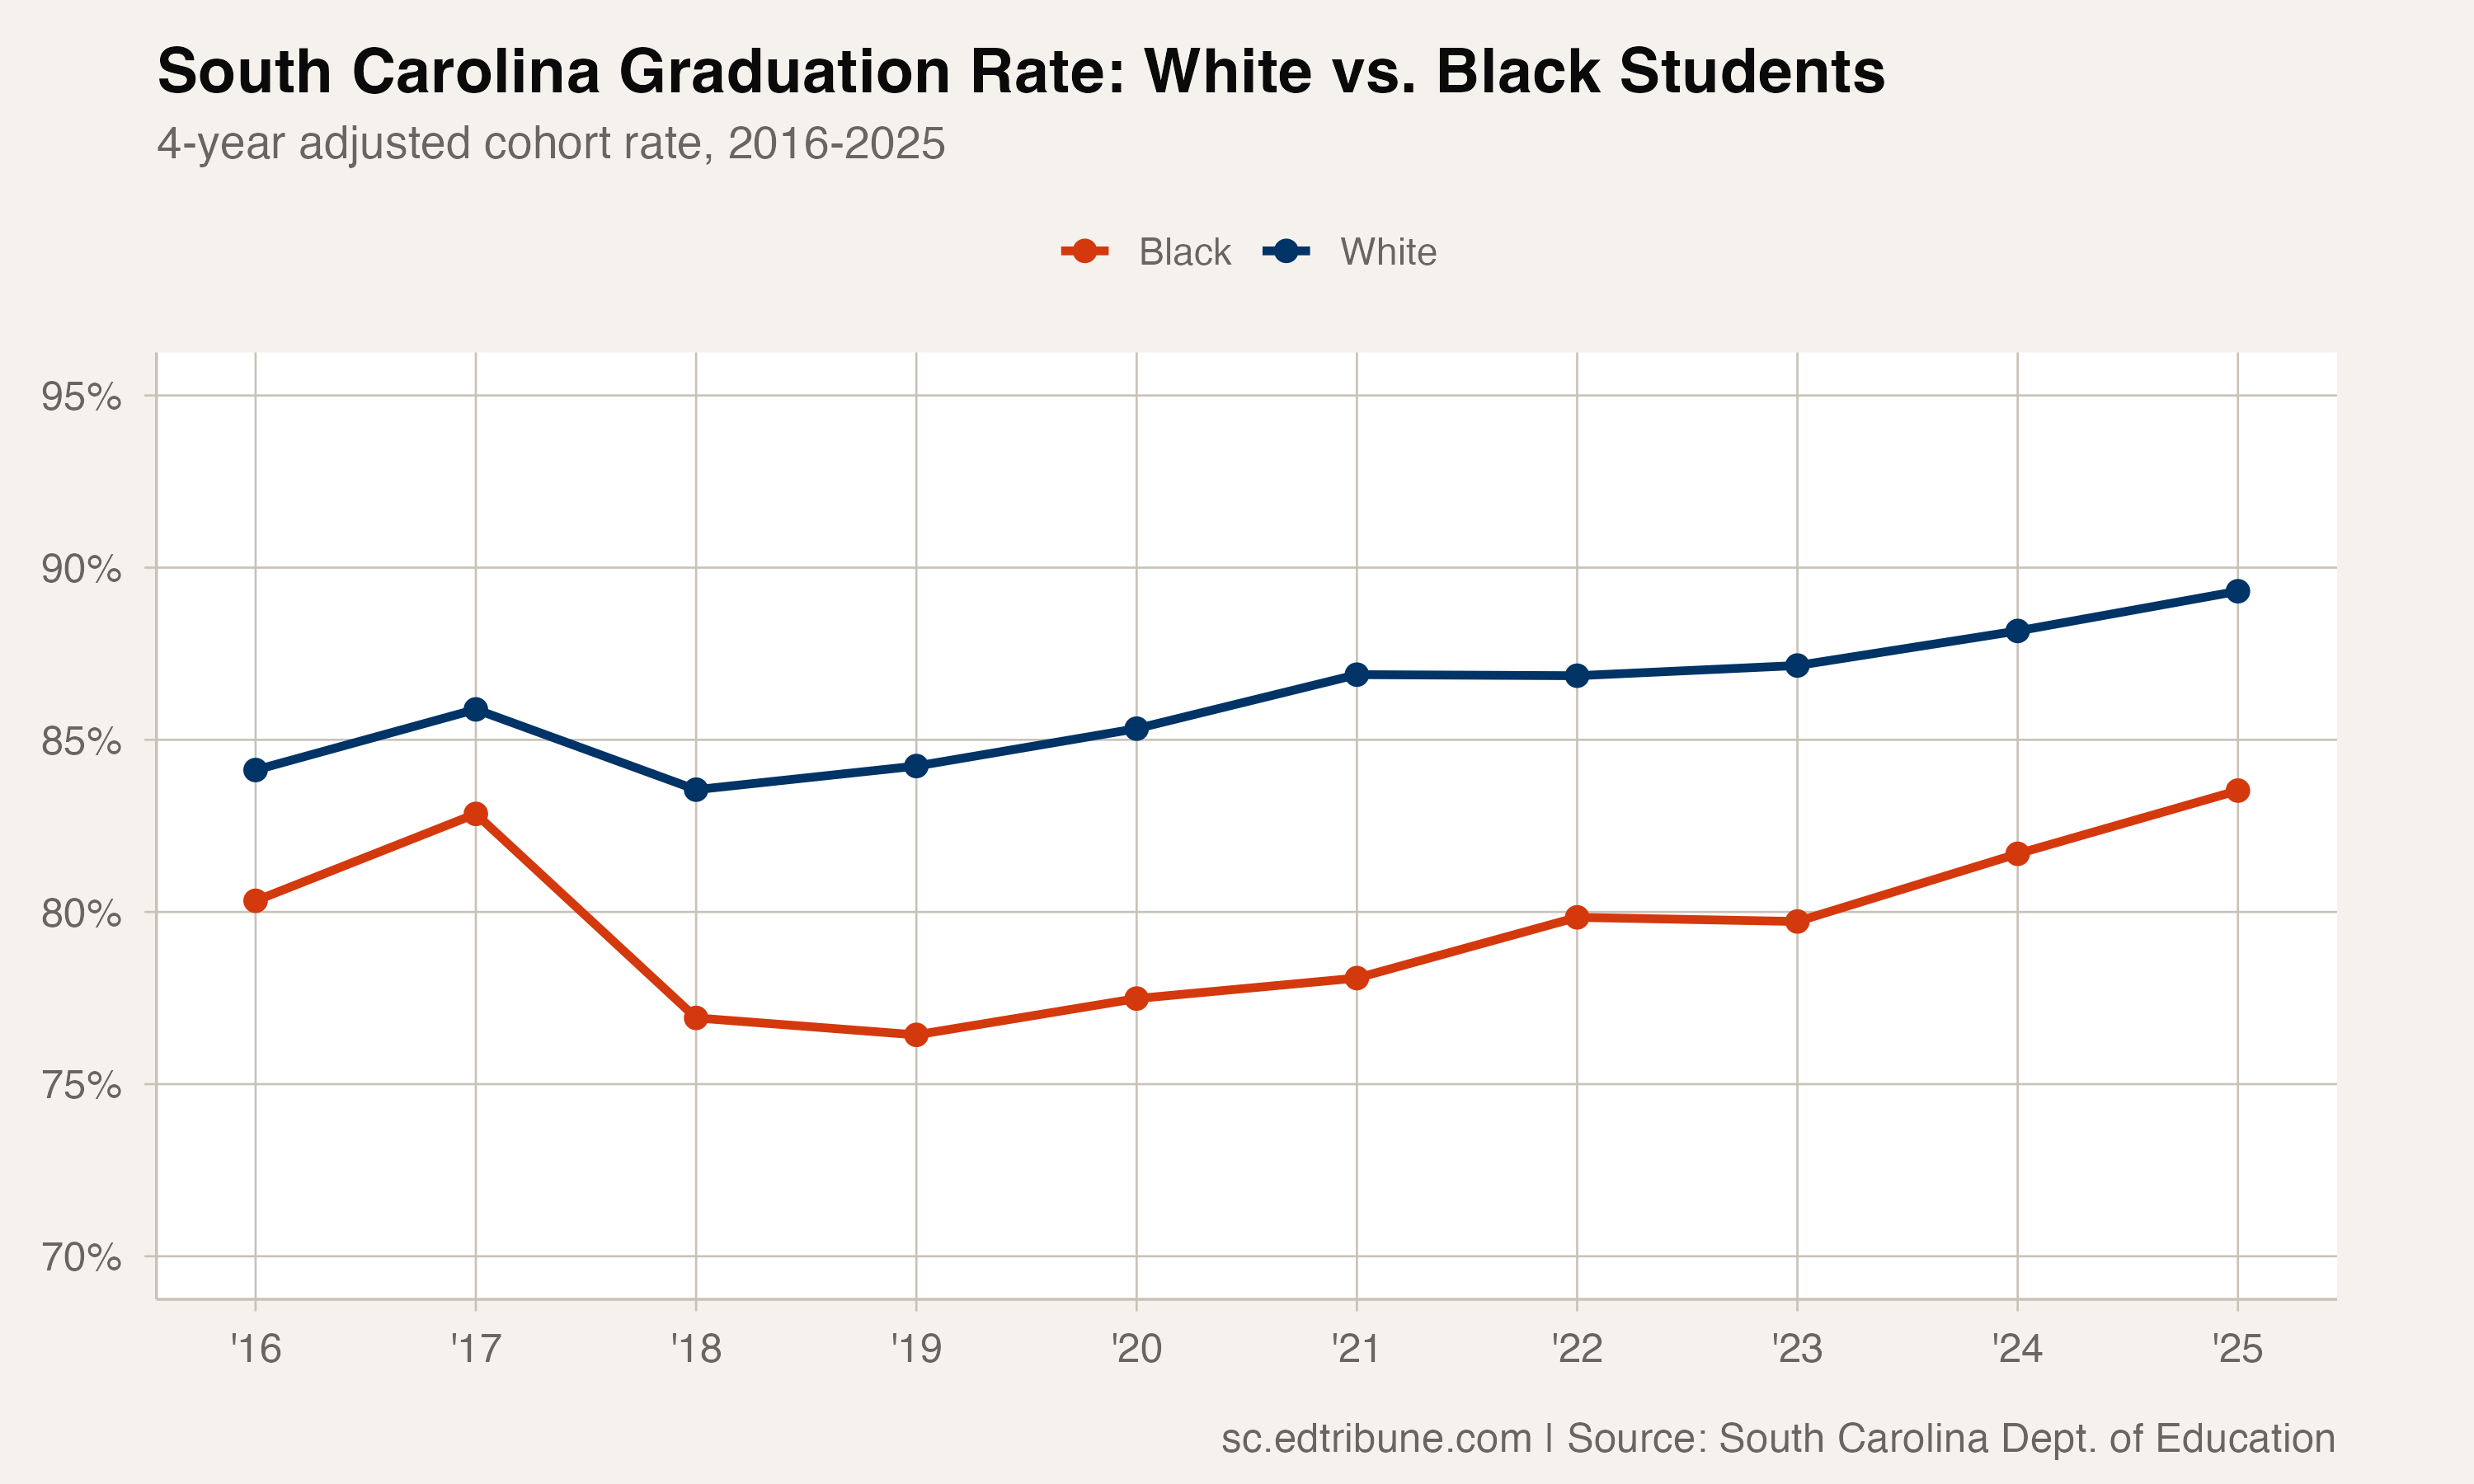
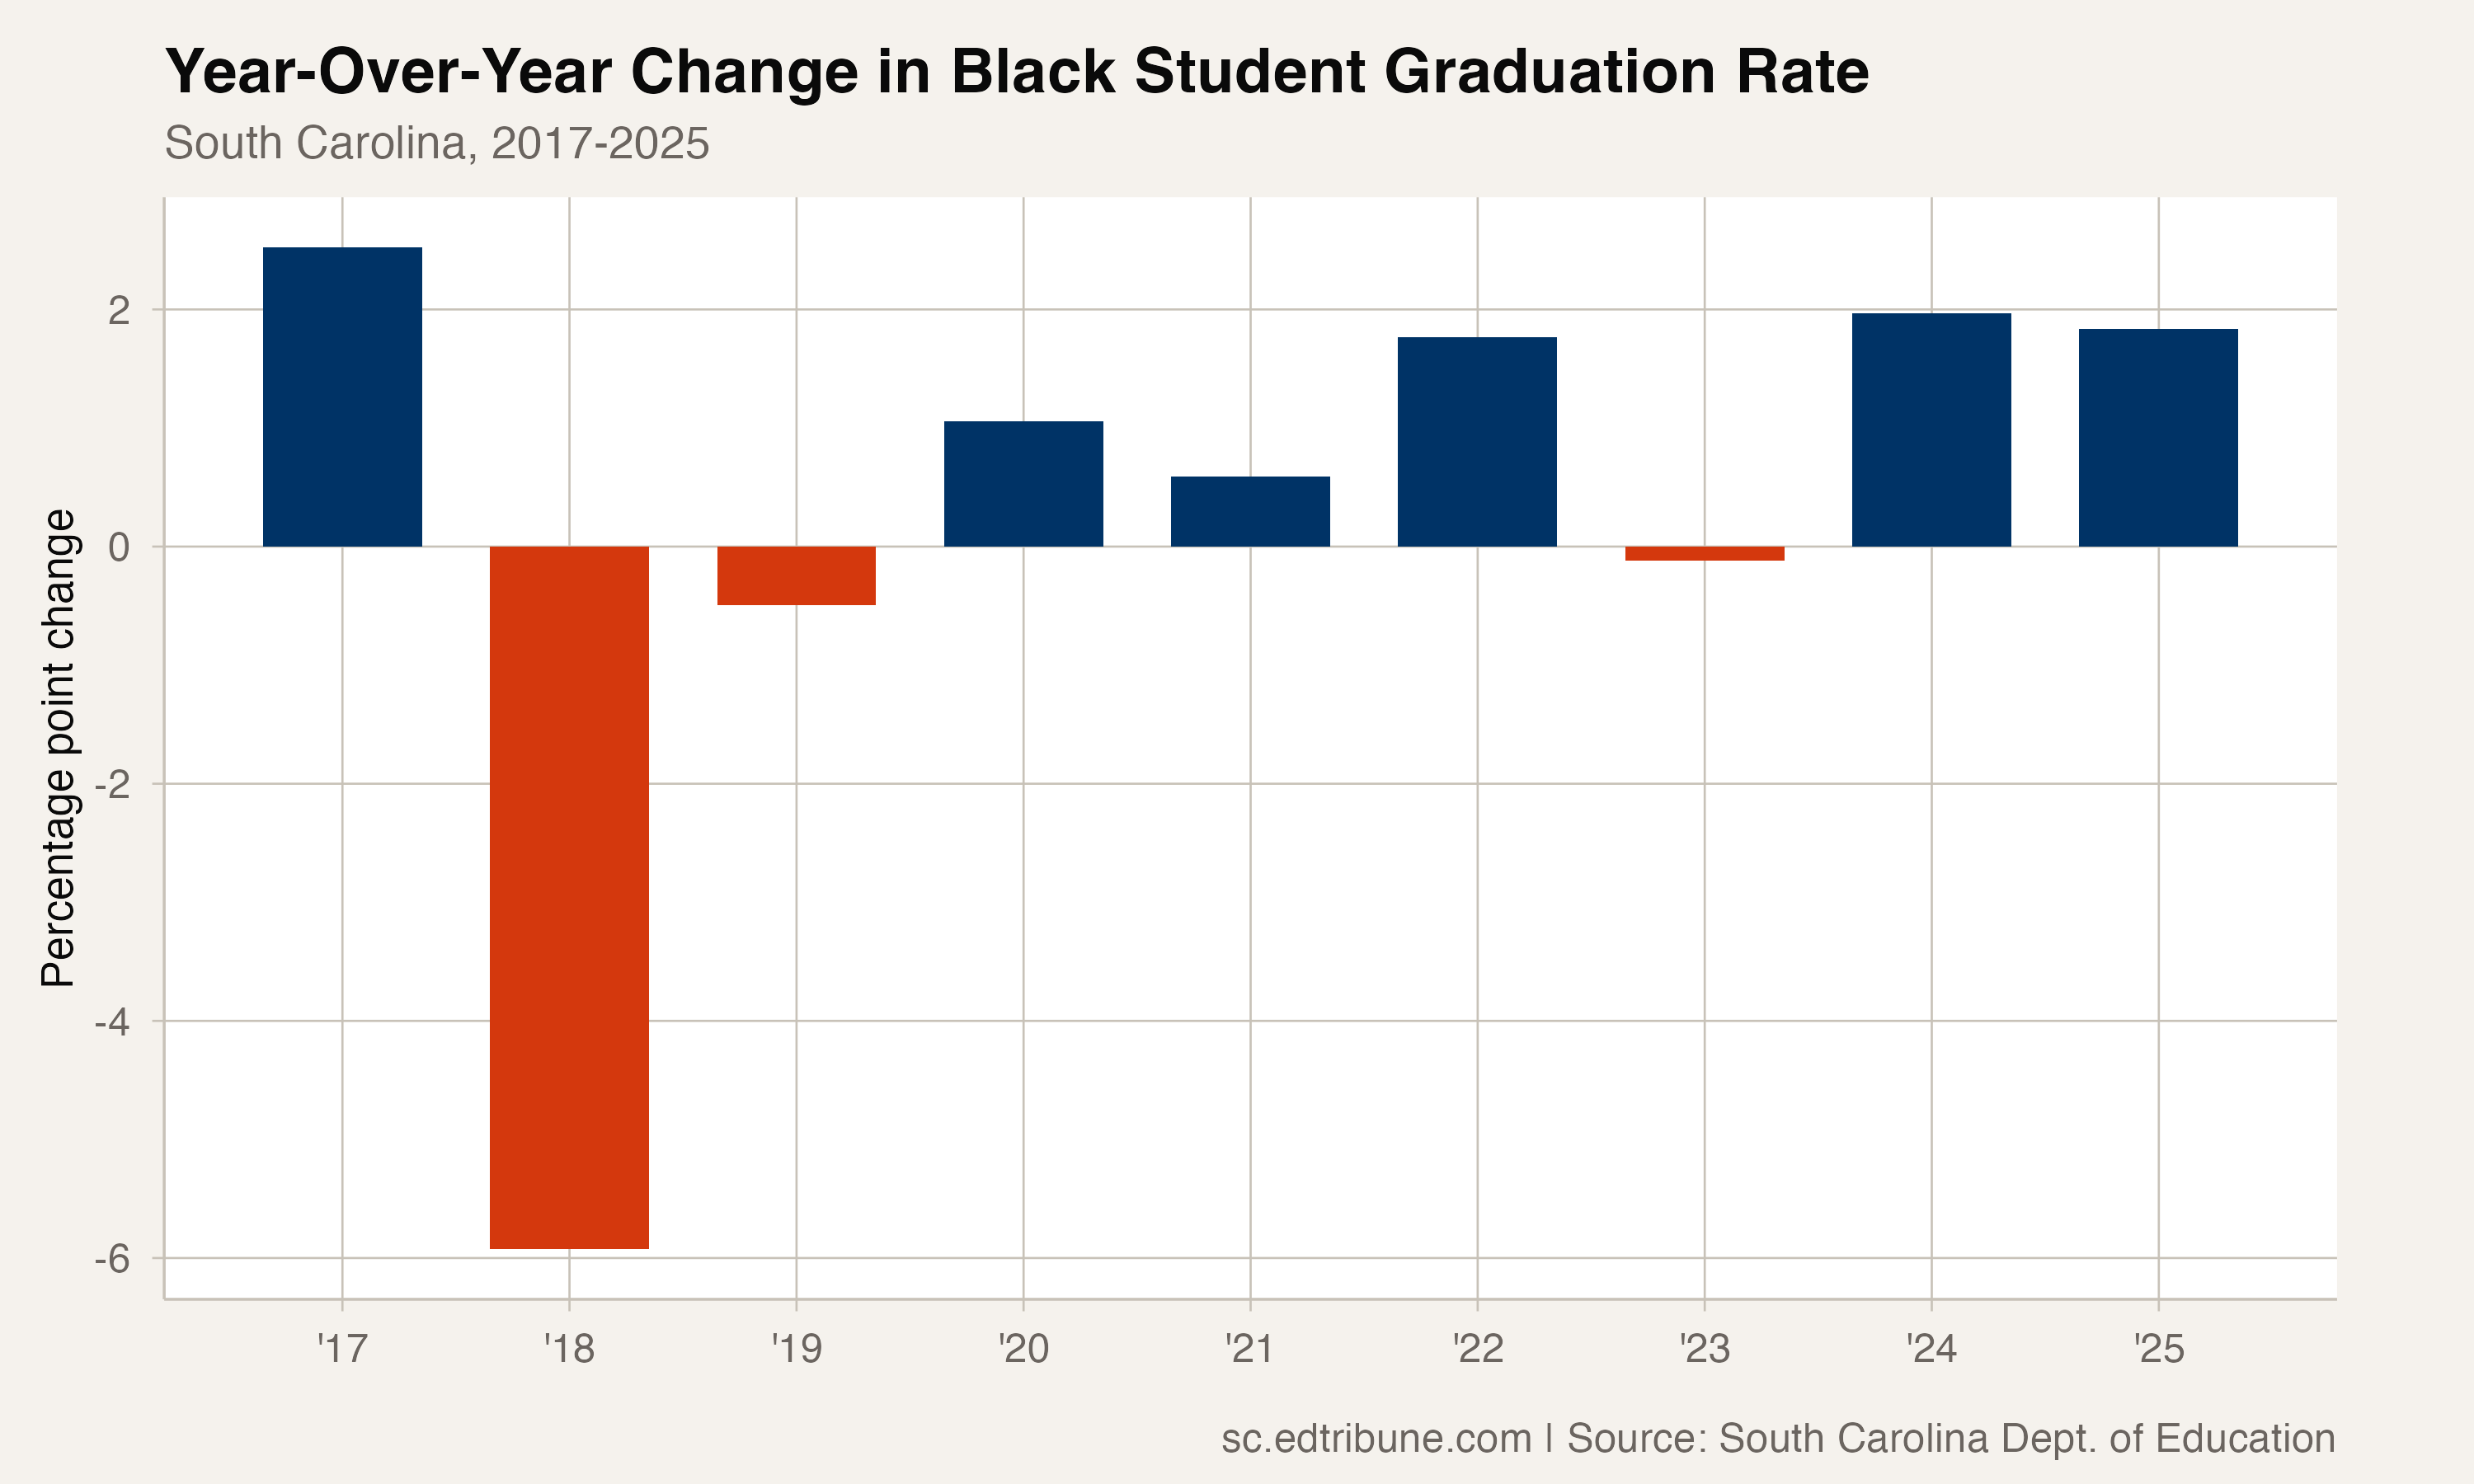
From 2017 to 2018, the white-Black gap widened sharply, driven by a cohort methodology change that expanded the denominator and pulled all rates down. Both groups declined, but Black rates fell harder, from 82.8% to 76.9% while white rates dropped from 85.9% to 83.6%. By 2018, the gap had stretched to 6.6 points.
From 2019 to 2021, the gap kept widening as white students recovered faster. White rates climbed steadily from 84.2% to 86.9%, while Black rates held in the 76-78% range for four consecutive years. The gap peaked at 8.8 points in 2021.
The reversal began in 2022. Black students gained 1.8 points that year, then 2.0 more in 2024, and another 1.8 in 2025, three of the four largest single-year gains the subgroup has posted in the past decade. Over the last four years, Black students gained 5.4 percentage points while white students gained 2.4, closing the gap by 3 points.
By the numbers: 83.5% of Black students in South Carolina's class of 2025 graduated on time: 22,446 students in the cohort, 18,748 graduates. Four years ago, the rate was 78.1%.
The scale of the Black student cohort
South Carolina's Black graduation cohort is substantial: 22,446 students in 2025, 35.4% of the state's total cohort. This is not a small subgroup where rate changes can be driven by a few dozen students. A one-percentage-point improvement means roughly 225 additional graduates.
The cohort has been stable in size, ranging from 19,438 in 2017 to 22,446 in 2025. The rate improvements represent genuine academic gains, not compositional shifts from a shrinking denominator. Black students are joined in the recent recovery by Hispanic and Native American peers, who posted similar two-year gains of about 4.2 points each, a broad-based improvement across racial lines.
Districts that have closed the gap
At the district level, the white-Black gap varies enormously. Among districts with at least 200 students of each race in their cohort, several have closed it entirely.
Sumter↗ET reversed it: Black students graduated at 81.0%, ahead of white students at 77.2%. Spartanburg 6↗ET posted 90.2% Black to 89.7% white, a 0.5-point Black-favored gap. Greenwood 50↗ET showed 85.3% Black to 84.6% white. Florence 1↗ET split 91.6% Black to 92.3% white, a difference of less than a point. Dorchester 2↗ET graduated 90.2% of Black students against 92.1% of white students, a 1.9-point gap.
These districts span the performance range, from Sumter's 79.8% overall rate to Dorchester 2's 91.4%. What they share is proportional improvement: both groups graduate at rates that track each other rather than one pulling ahead.
The widest district gap belongs to the SC Public Charter District at 16.2 points (67.7% Black vs. 83.9% white). Charleston↗ET shows an 8.9-point gap (86.6% vs. 95.5%) despite posting a strong overall rate of 90.6%: the white rate is unusually high there, not the Black rate unusually low.
Still wider than the 2017 baseline
The narrowing is real, but the work is not finished. The gap is 5.8 points in 2025, down from 8.8 in 2021 but still wider than the 3.0 points recorded in 2017, the most recent year before the methodology change. At the current pace of narrowing, roughly 0.75 points per year since 2021, it would take until about 2030 to return to the 2017 spread.
The post-2018 era (the apples-to-apples comparison) shows a gap that widened from 6.6 to 8.8 and has since narrowed to 5.8. Within that window, the trajectory is unmistakably positive.
Black students are improving faster than white students, the gap is shrinking, and the cohort is large enough that these are not artifacts of small-sample volatility. Whether the narrowing continues depends on whether the investments driving it (credit recovery, ninth-grade interventions, mentoring programs) are sustained as the easiest gains are realized.
Detailed code that reproduces the analysis and figures in this article is available exclusively to EdTribune subscribers.
Discussion
Sign in to join the discussion.
Loading comments...