Correction (August 1, 2026): An earlier version of this article, including its headline, said youth in foster care graduate at less than half the state rate. At 44.8% against a state rate of 86.7%, the foster care rate is barely half the state rate, not less than half. The same version said the foster care rate fell even as every other subgroup improved. English learners and students who are economically disadvantaged also lost ground over the same seven years.
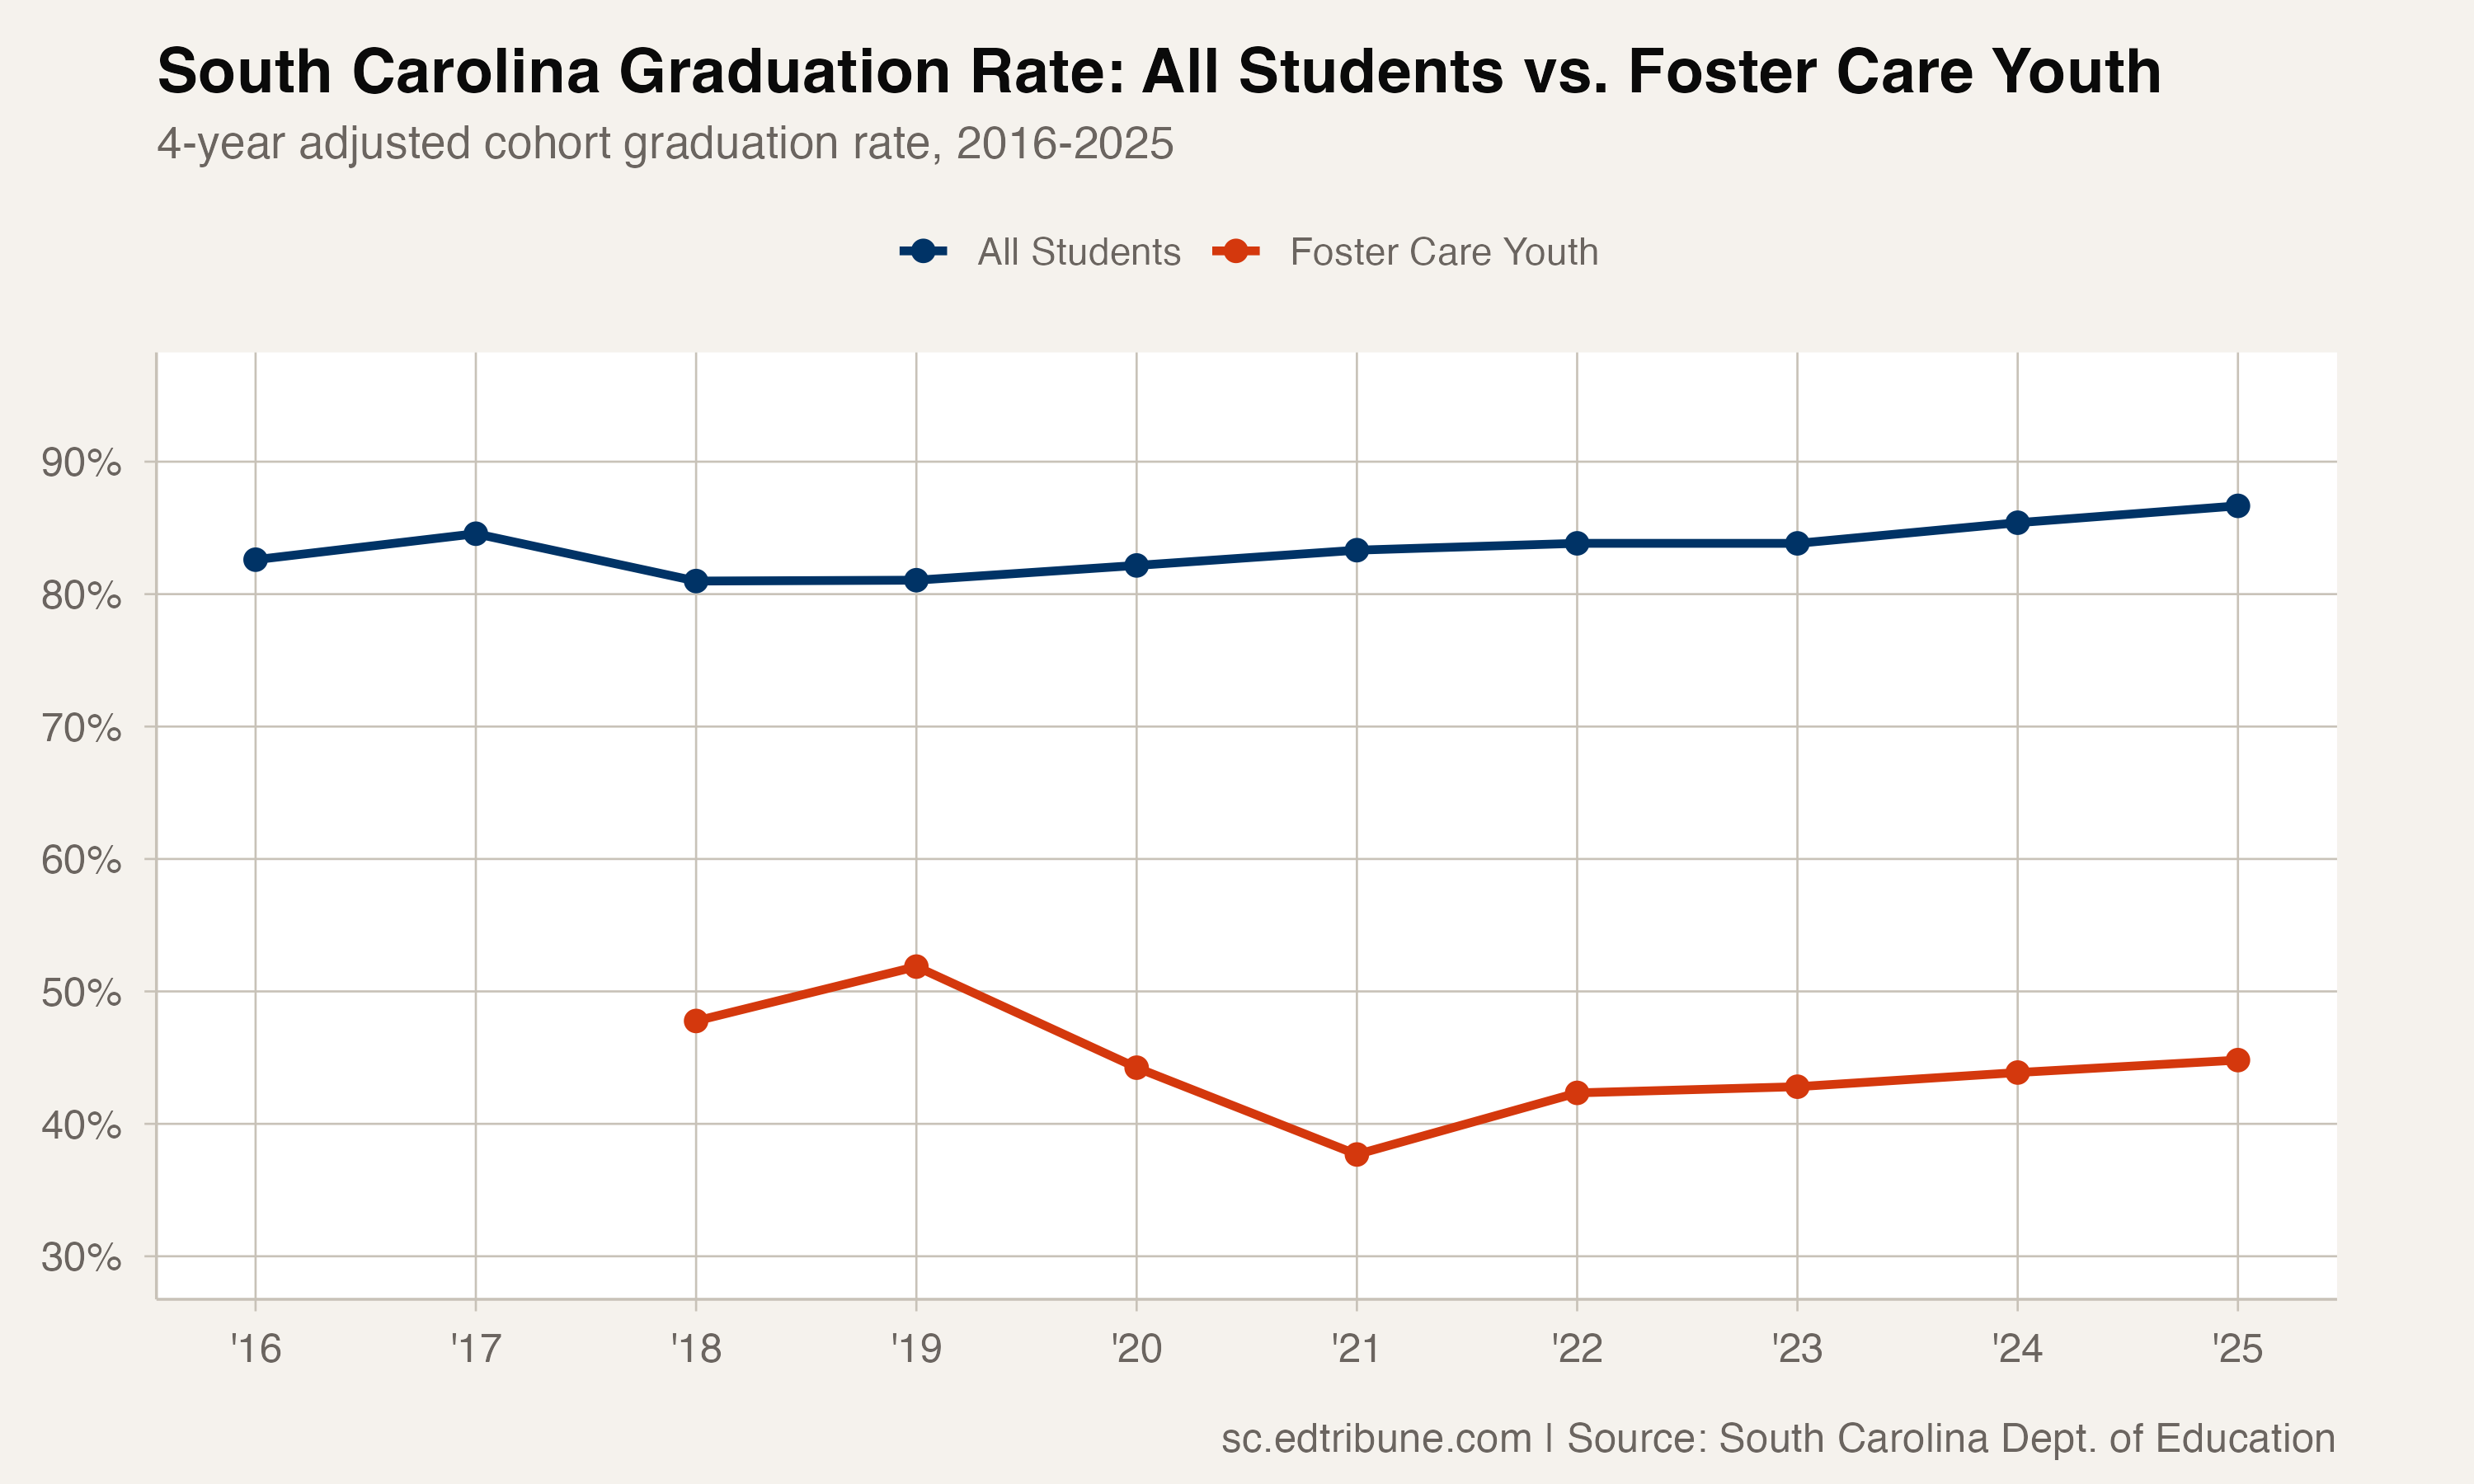
South Carolina's four-year adjusted cohort graduation rate reached 86.7% in 2025, an all-time high, and the culmination of a steady rise from the 81.0% floor the state hit in 2018. The class of 2025 produced 54,980 graduates from a record cohort of 63,440 students. By nearly every measure, the state's graduation machinery is working better than it ever has.
But 453 students sat outside that machinery entirely.
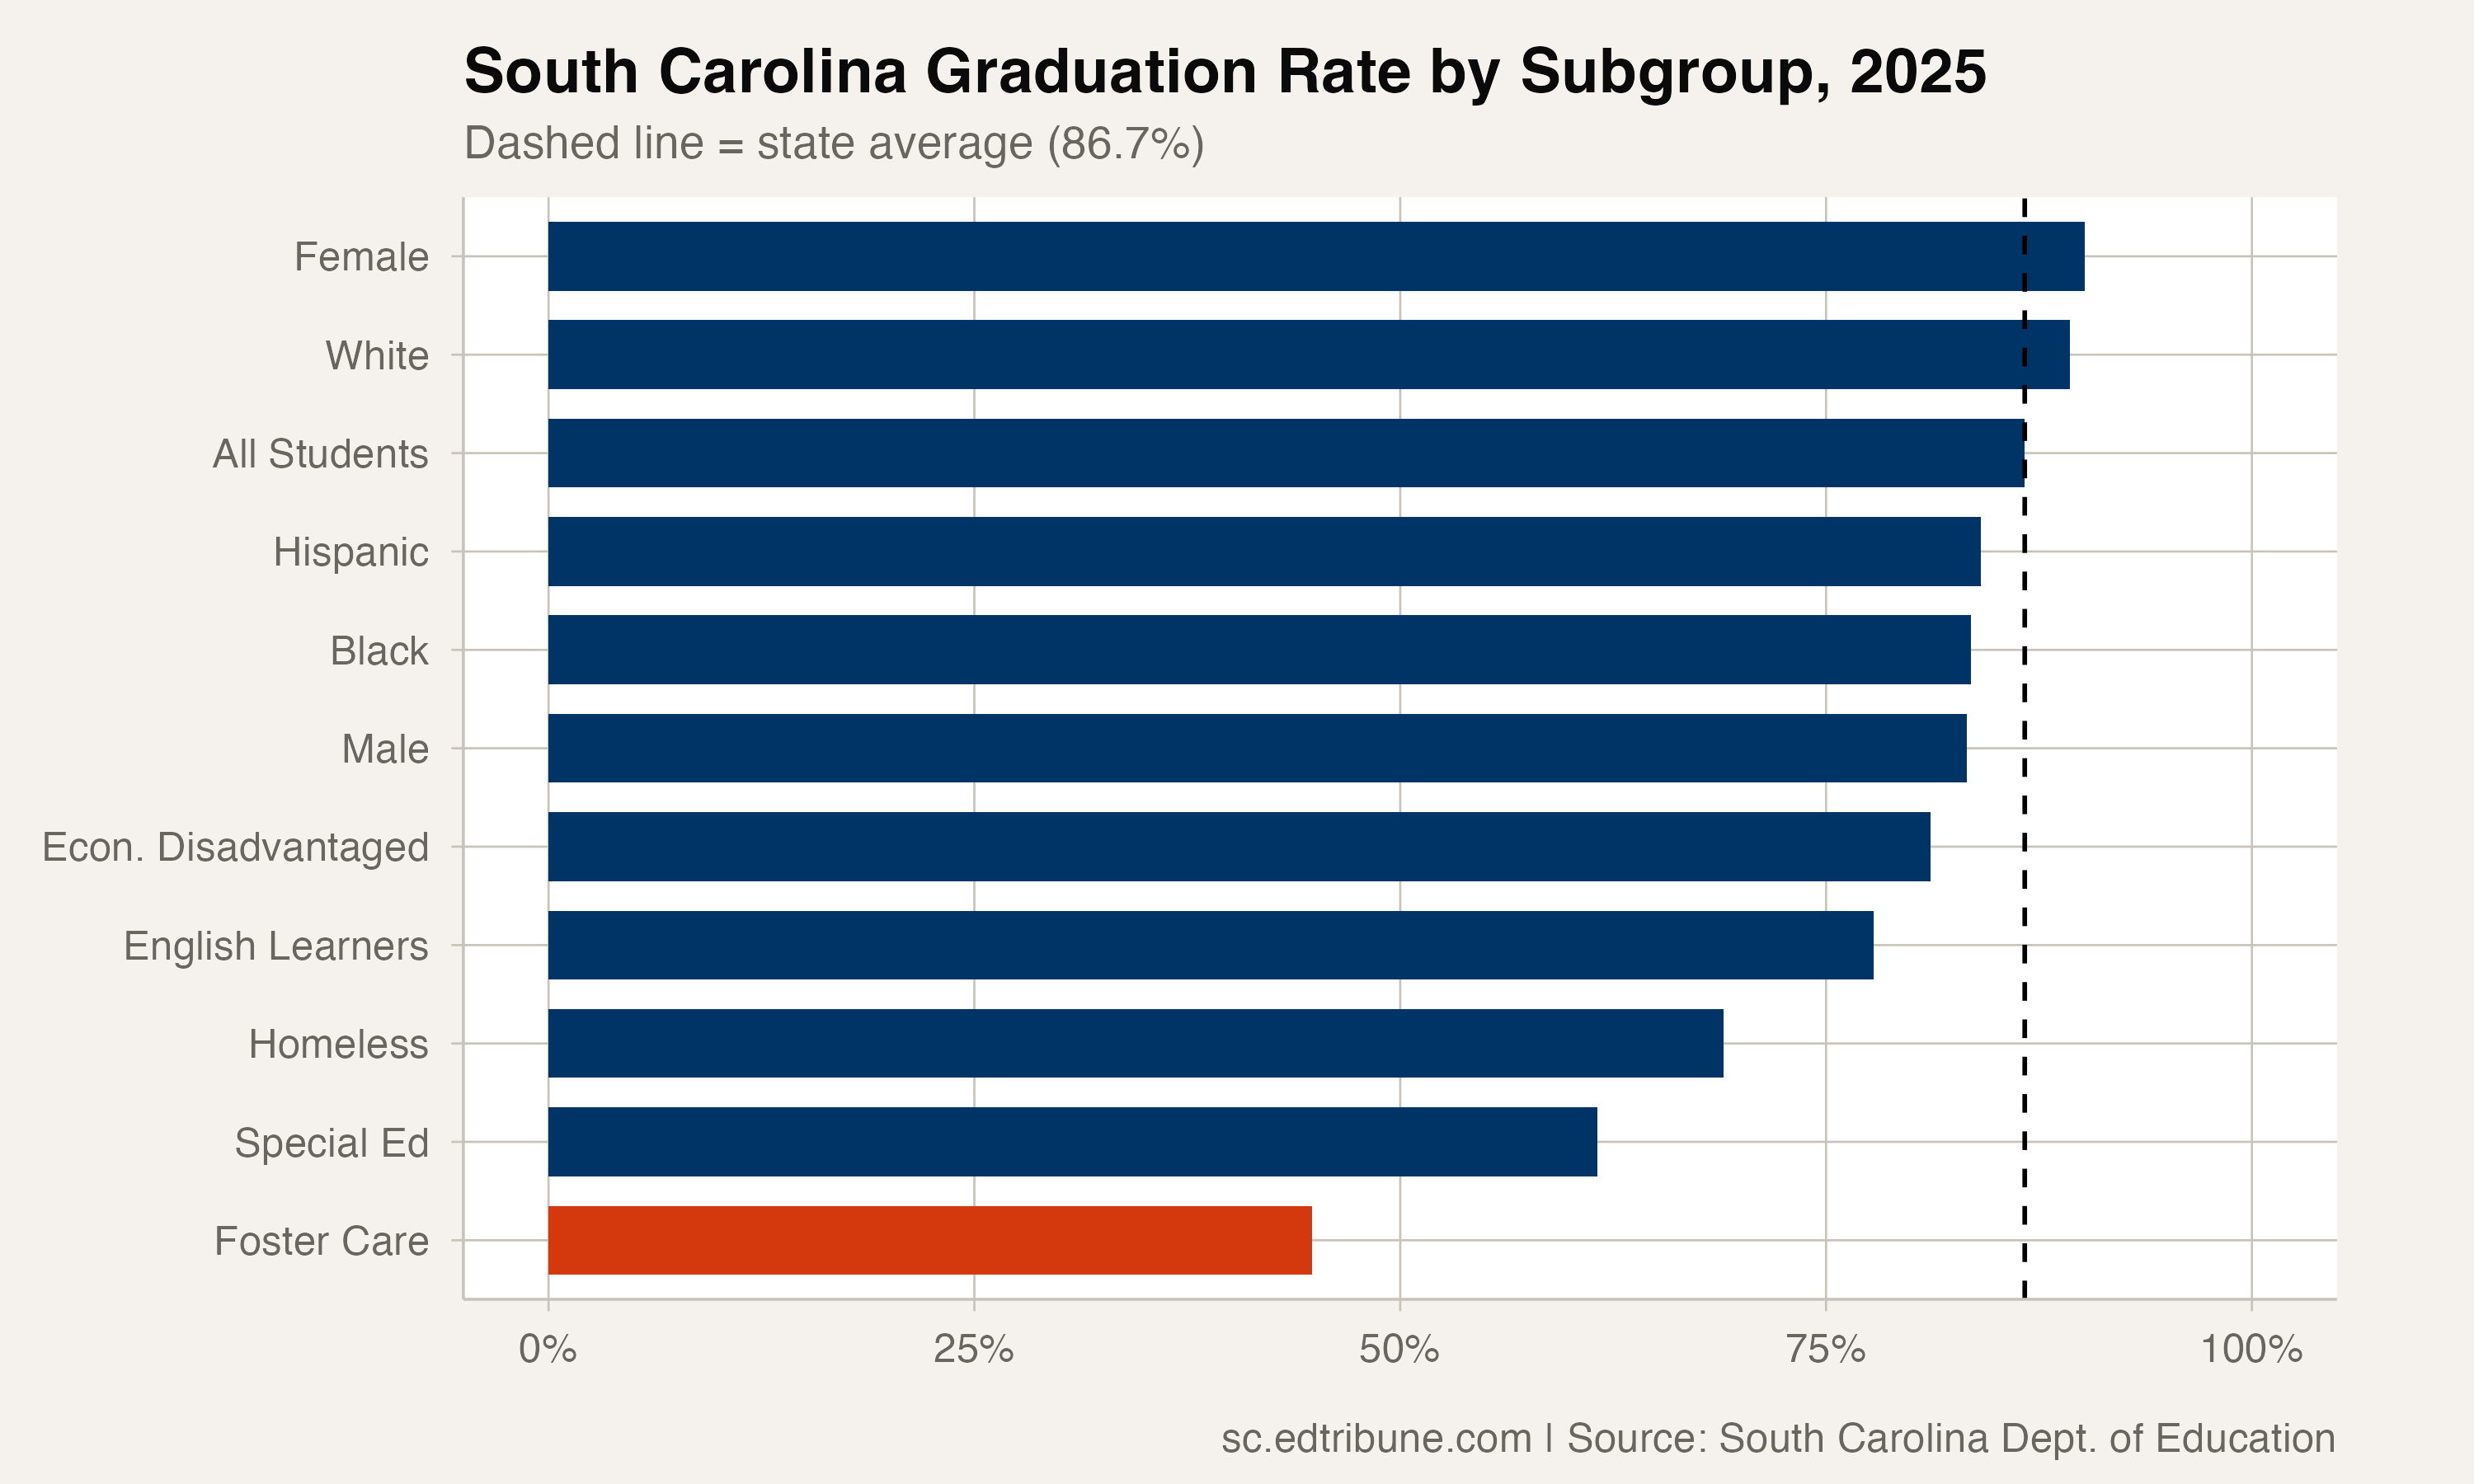
Youth in foster care in South Carolina graduated at 44.8% in 2025, barely half the state rate and the widest equity gap in the state's data at 41.9 percentage points. No other subgroup comes close. Students with disabilities, at 61.6%, trail the state by 25 points. Students who are currently homeless, at 69.0%, by 18. Youth in foster care occupy a category of their own.
A gap that refuses to move
The foster care graduation rate has been available since 2018, when it stood at 47.8%. Seven years later, the rate is 44.8%, three points lower than where it started, and the steepest decline of any subgroup the state reports. English learners and students who are economically disadvantaged also lost ground over the same period. The rate bottomed out at 37.7% in 2021, recovered slightly, and has hovered in the low-to-mid 40s ever since.
What makes this pattern particularly stubborn is that the cohort grew substantially over the same period. In 2018, 224 students in foster care entered the graduation pipeline. By 2025, that number had doubled to 453. More students entered the system, and the system's capacity to graduate them did not scale.
By the numbers: 453 students in foster care were in South Carolina's class of 2025 graduation cohort. Just 203 walked at commencement. The other 250 did not finish on time.
Where the gaps actually are
The 2025 subgroup breakdown reveals a clear hierarchy of disadvantage. At the top: Asian students at 94.6%, female students at 90.2%, white students at 89.3%. In the middle: Black students at 83.5%, Hispanic students at 84.1%, students who are economically disadvantaged at 81.1%. At the bottom: English learners at 77.8%, students who are currently homeless at 69.0%, students with disabilities at 61.6%.
And then, 17 points below even students with disabilities: youth in foster care at 44.8%.
The gap is not narrowing. In 2018, the distance between youth in foster care and all students was 33.2 percentage points. In 2025, it is 41.9 points. The state improved; students in foster care did not. The gap widened by nearly nine points over seven years.
A growing cohort, a flat rate
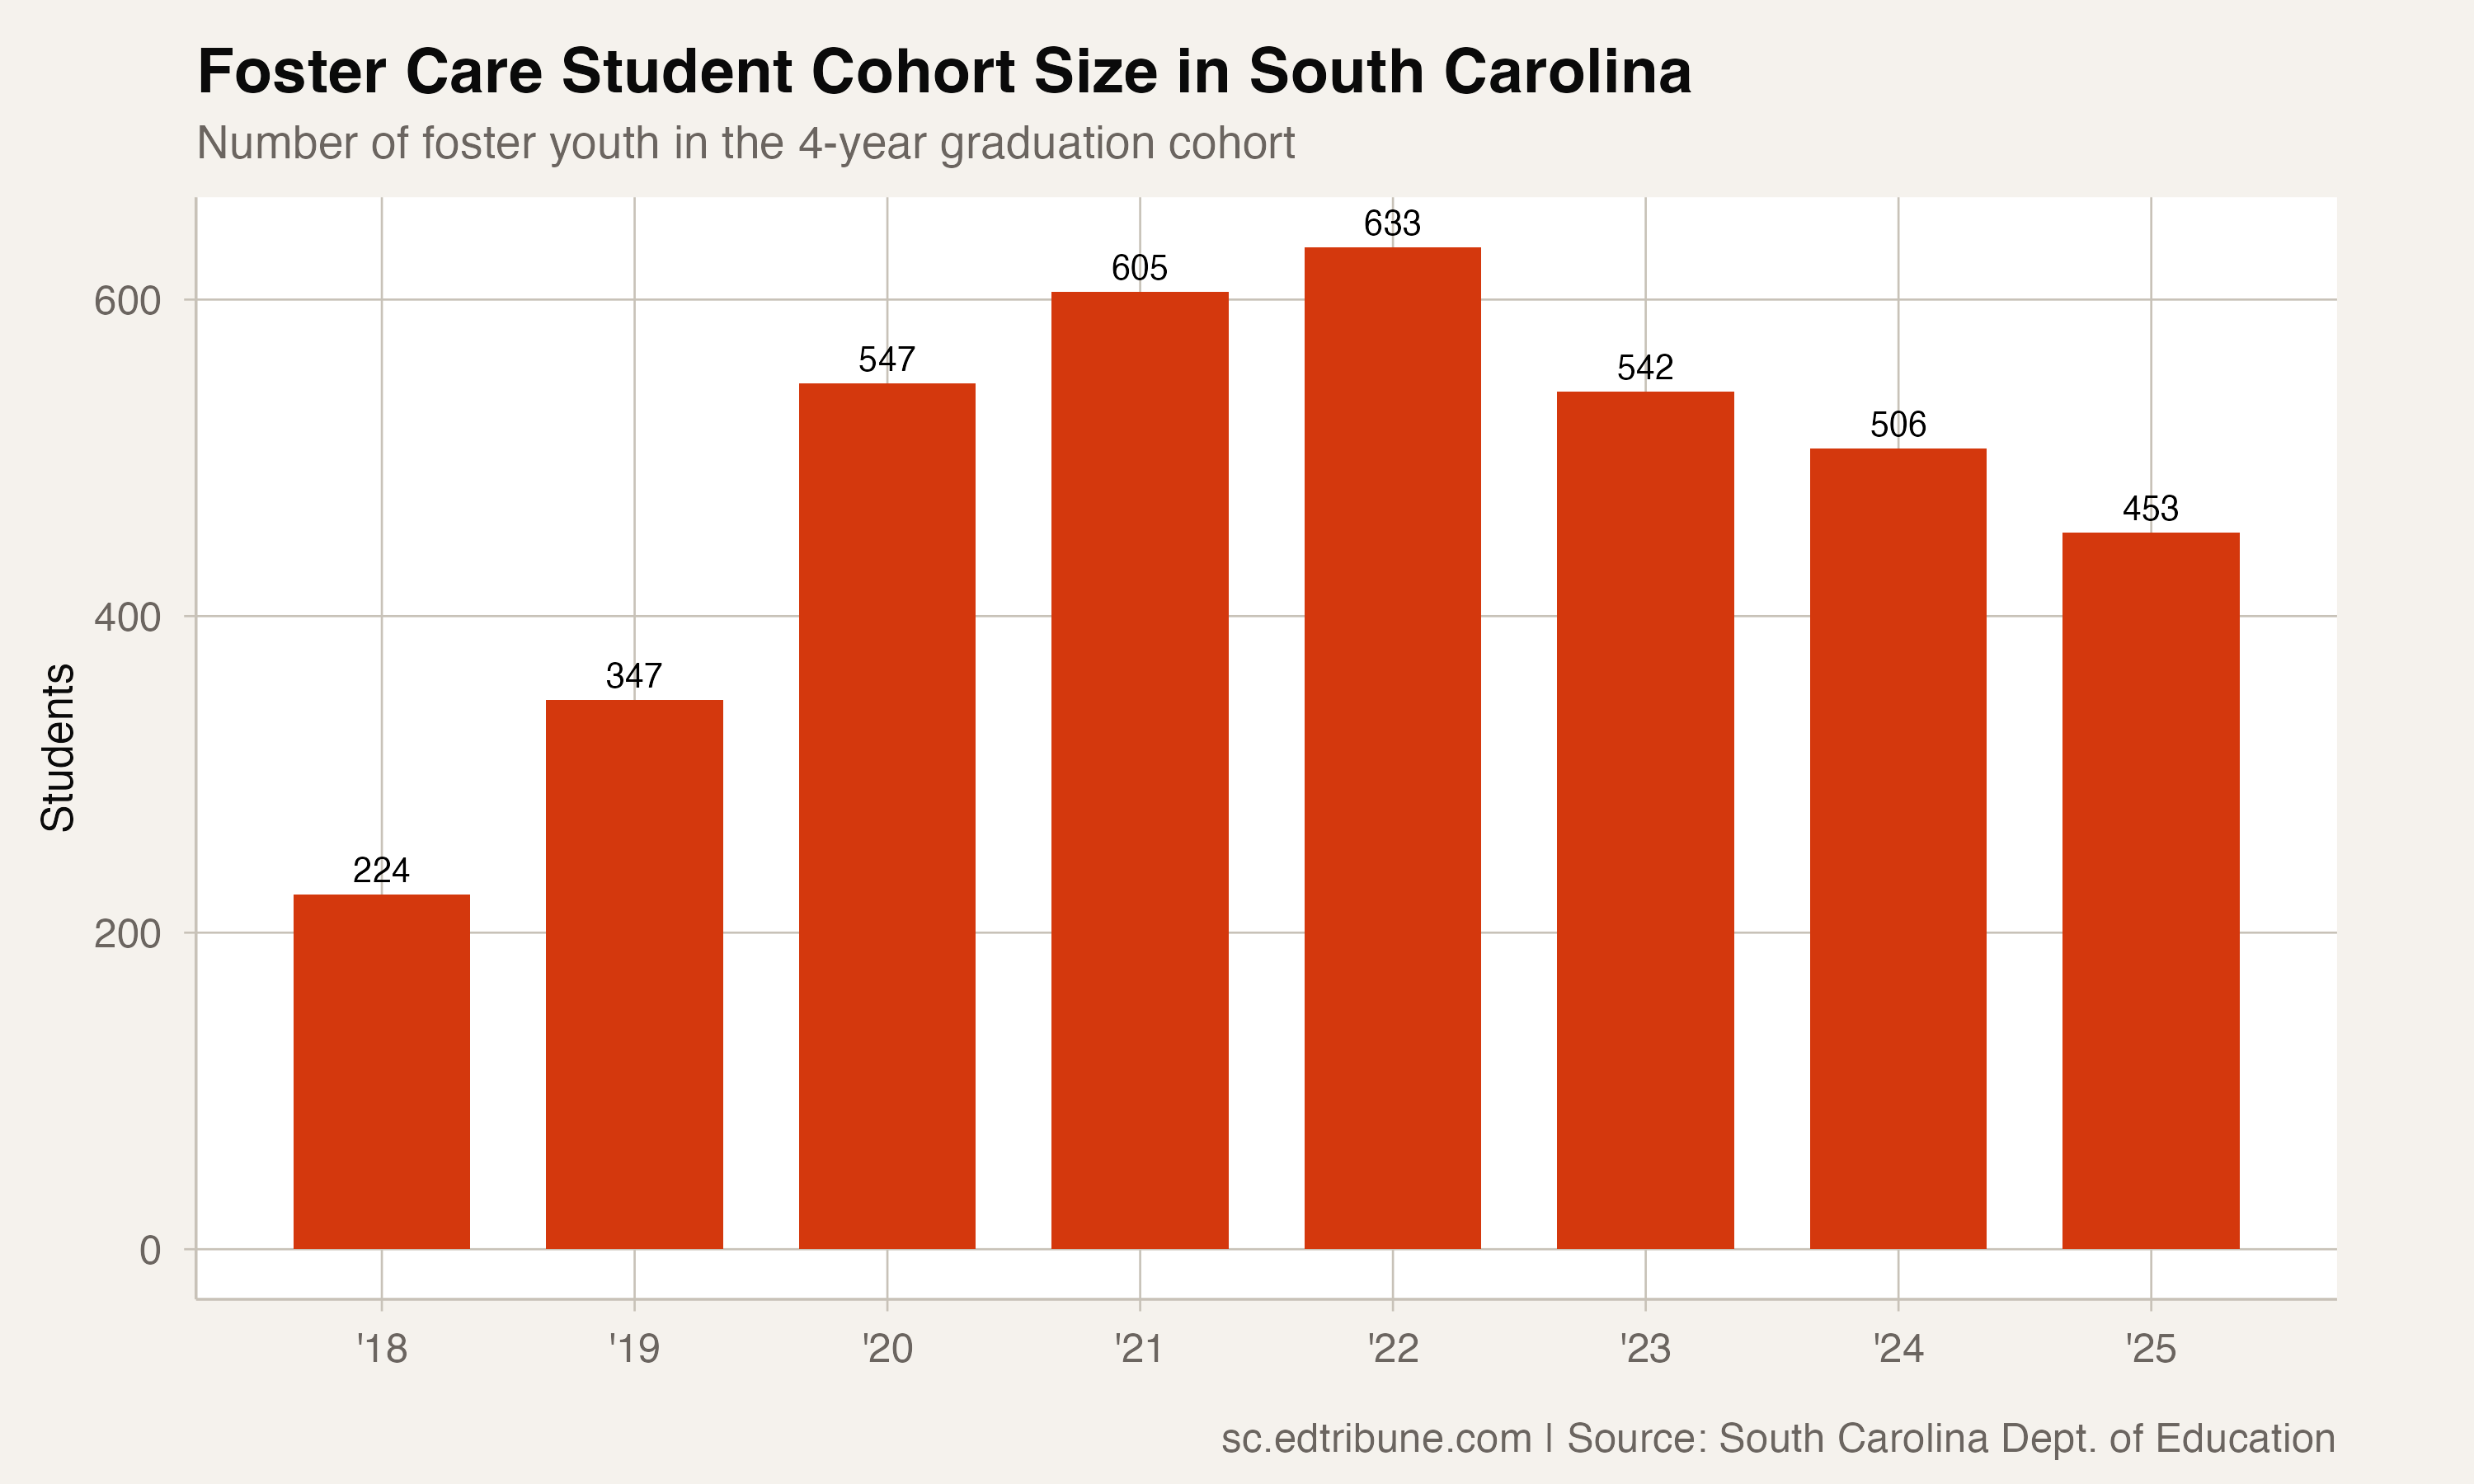
The foster care cohort more than doubled from 224 students in 2018 to a peak of 633 in 2022. It has since declined to 453 in 2025. The rate has not meaningfully responded to changes in cohort size: it was 47.8% with 224 students and 44.8% with 453. Whether the cohort grows or shrinks, roughly half of students in foster care in South Carolina do not graduate on time.
South Carolina lacks a tuition waiver or dedicated scholarship program for youth aging out of foster care, according to the National Conference of State Legislatures. The absence of that policy lever means the pipeline from high school to postsecondary is even more precarious for the students who do manage to graduate.
The policy question behind the headline
South Carolina's all-time high graduation rate is real and represents genuine, broad-based improvement across nearly every demographic group. The 2018 cohort methodology change makes pre-2018 comparisons unreliable, but within the post-2018 era, the rate has never declined, rising from 81.0% to 86.7% with a brief plateau at 83.8% in 2022-23 before accelerating again.
The foster care gap is equally real. It suggests that whatever is driving statewide improvement (better retention programs, expanded credit recovery, stronger ninth-grade transitions) is not reaching students whose lives are disrupted by placement changes, school transfers, and the instability that defines the child welfare system.
A 41.9 percentage-point gap does not close with incremental improvements. It closes with targeted intervention, dedicated resources, and the kind of policy attention that South Carolina has not yet directed at its most vulnerable graduates.
Detailed code that reproduces the analysis and figures in this article is available exclusively to EdTribune subscribers.
Discussion
Sign in to join the discussion.
Loading comments...