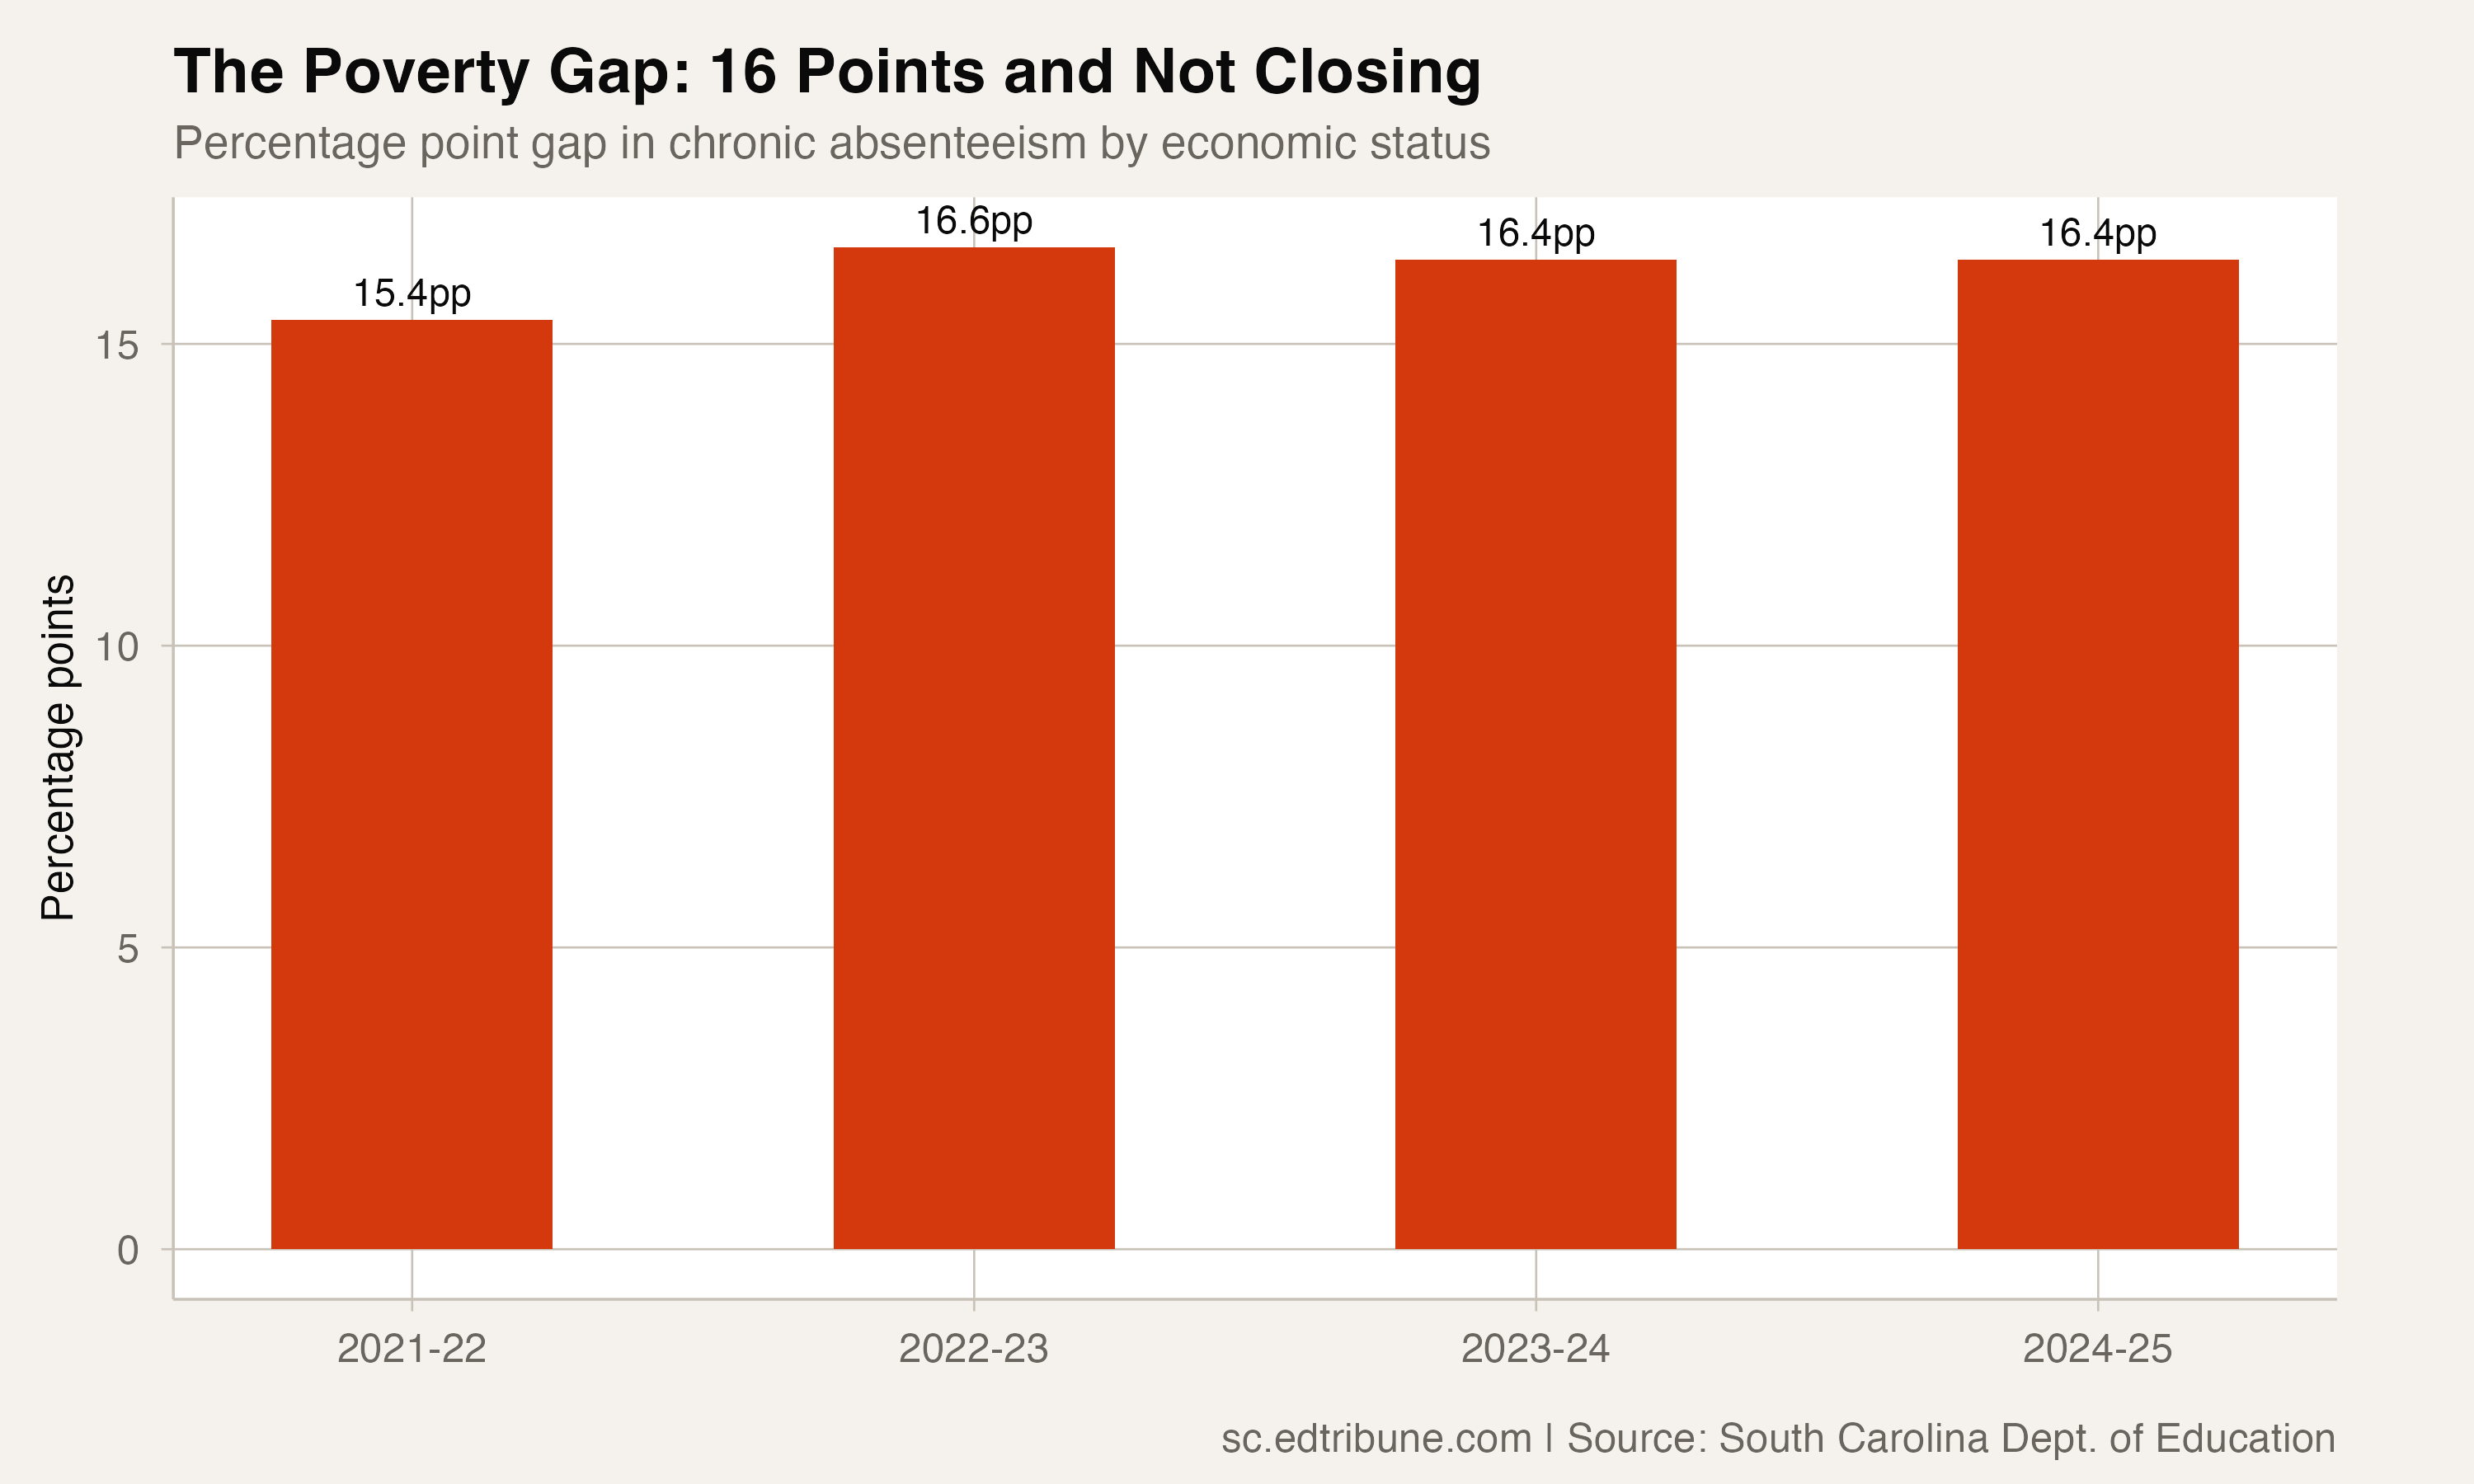
The gap is 16.4 percentage points. It has been roughly 16 percentage points for every year South Carolina has measured chronic absenteeism. It was 15.4 points in 2021-22, widened to 16.6 in 2022-23, and has held at 16.4 for two consecutive years since. If chronic absenteeism is the crisis, this is the crisis within the crisis: the structural divide between students whose families have economic stability and those who do not.
In 2024-25, 28.5% of economically disadvantaged students in South Carolina were chronically absent, missing at least 10% of school days. For their non-disadvantaged peers, the rate was 12.1%. Both groups improved from the 2022-23 peak. Both improved at roughly the same pace. The parallel recovery is the problem.
Parallel lines
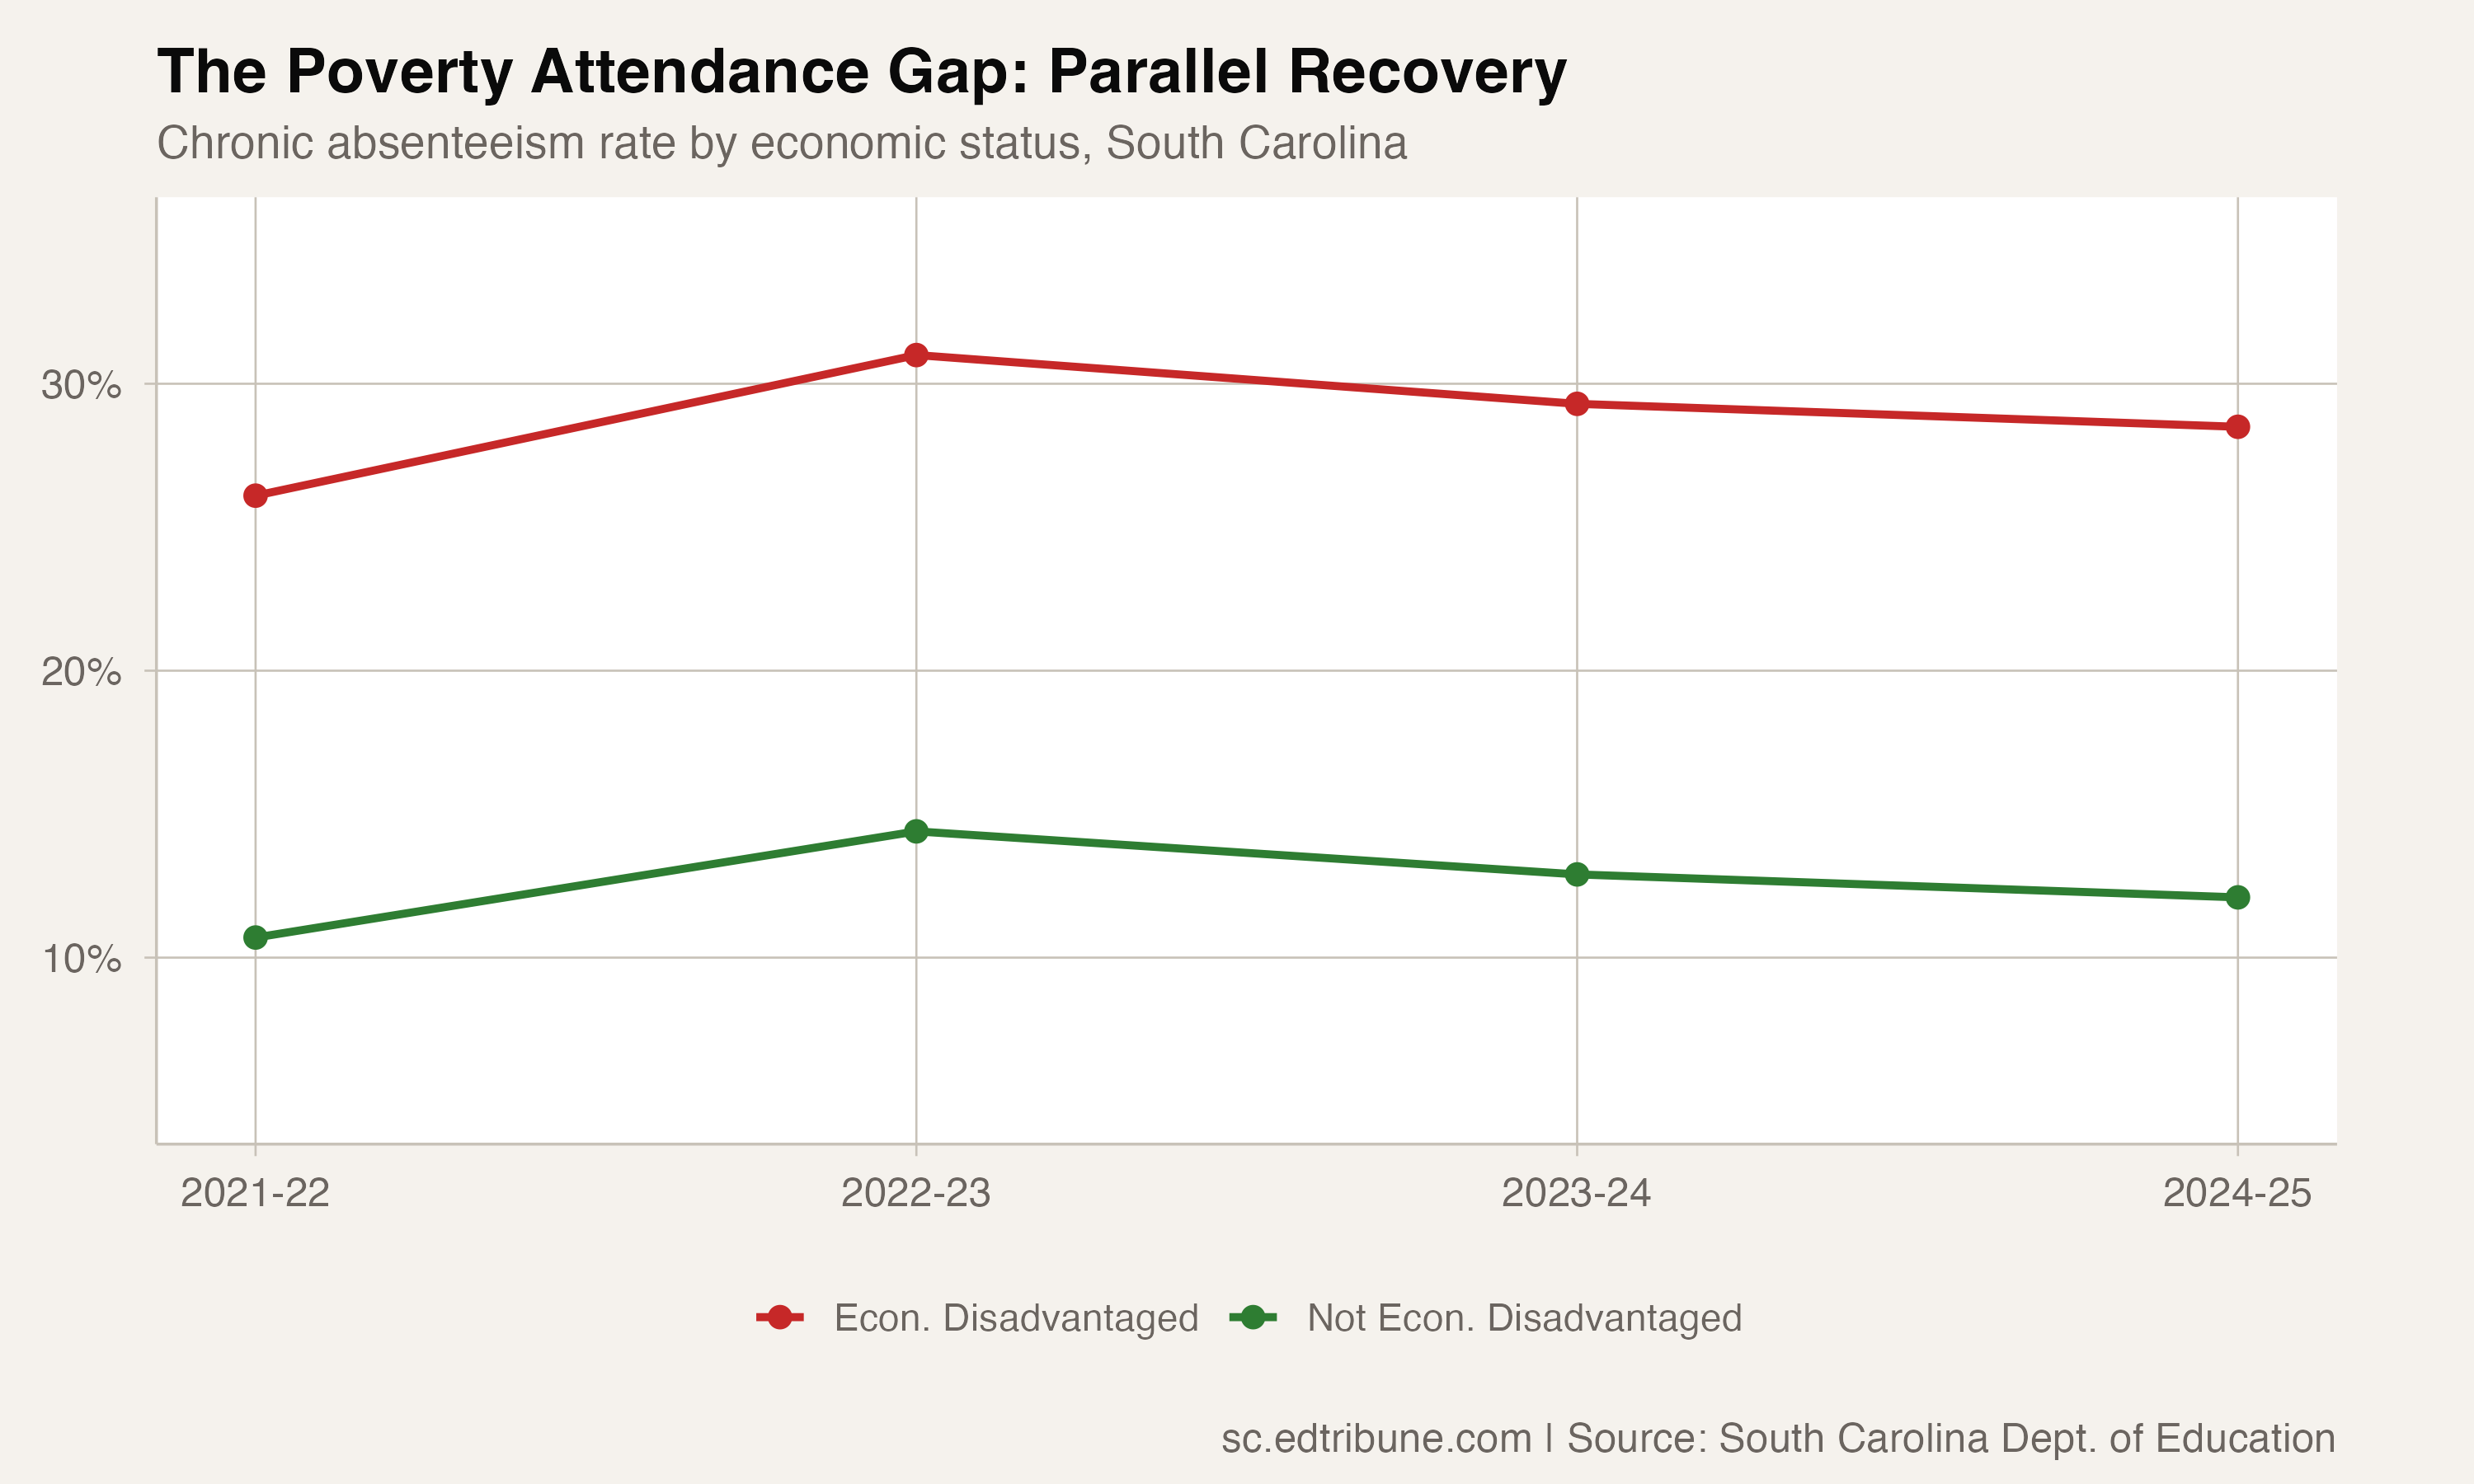
The shape of these two lines tells a story about what South Carolina's post-COVID recovery has and has not accomplished. Whatever is driving the improvement, whether it is the return of school routines, increased counselor staffing, or the passage of time, it is reaching disadvantaged and non-disadvantaged students in equal measure. That sounds equitable until you realize that equal improvement from unequal starting positions preserves the inequality.
A 16.4-point gap means an economically disadvantaged student in South Carolina is 2.4 times as likely to be chronically absent as a non-disadvantaged peer. That ratio has barely changed since measurement began.
140,000 students behind the number
The rate translates to 140,151 economically disadvantaged students chronically absent in 2024-25, out of 492,188 identified as economically disadvantaged. That population is 62.1% of the state's enrollment, meaning this is not a niche concern but a reality for the majority of South Carolina's public school students.
The 12.1% rate among non-disadvantaged students is close to what the overall state rate was before COVID. In a sense, non-disadvantaged students have nearly completed their recovery. Disadvantaged students have not, and at the current pace of improvement, the gap will persist for years.
Income is not attendance
South Carolina uses the economically disadvantaged classification broadly. Districts participating in the Community Eligibility Provision certify all students as eligible for free meals based on community poverty indicators, meaning some districts show near-100% economically disadvantaged rates that reflect program participation rather than individual family circumstances. The 62.1% statewide figure should be read as an administrative classification, not a precise poverty count.
But the attendance gap it reveals is real. The correlation between economic status and attendance holds across every district in the data. It holds in urban Charleston and rural Allendale. It holds in growing Fort Mill and declining Sumter. The mechanism is not mysterious: families with unstable housing, unreliable transportation, inconsistent access to healthcare, and inflexible work schedules produce children who miss more school. The state's response, so far, has not matched the scale.
The intervention gap
South Carolina's AttendNC Counts-style initiative focuses on school-level strategies: mentoring, attendance teams, parent engagement. These are valuable but tend to address symptoms, not the upstream causes. A student who misses school because a parent's car broke down needs transportation, not a mentoring session. A student who stays home to care for a younger sibling because child care fell through needs a child care subsidy, not an attendance contract.
Research from the SC Education Oversight Committee found that students themselves identify mental health, safety concerns, and family obligations as primary drivers. These are problems rooted in poverty, and they will require poverty-level investment to address.
The gap is 16.4 percentage points. It was 15.4 four years ago. It will be roughly 16 next year, and the year after that, unless something changes in a way that nothing has changed yet.
Detailed code that reproduces the analysis and figures in this article is available exclusively to EdTribune subscribers.
Discussion
Sign in to join the discussion.
Loading comments...