South Carolina reported 176,344 chronically absent students in 2024-25, last school year's most recent published data. The South Carolina Department of Education defines the measure from the share of enrolled school days a student misses and includes excused absences, unexcused absences, and suspensions.
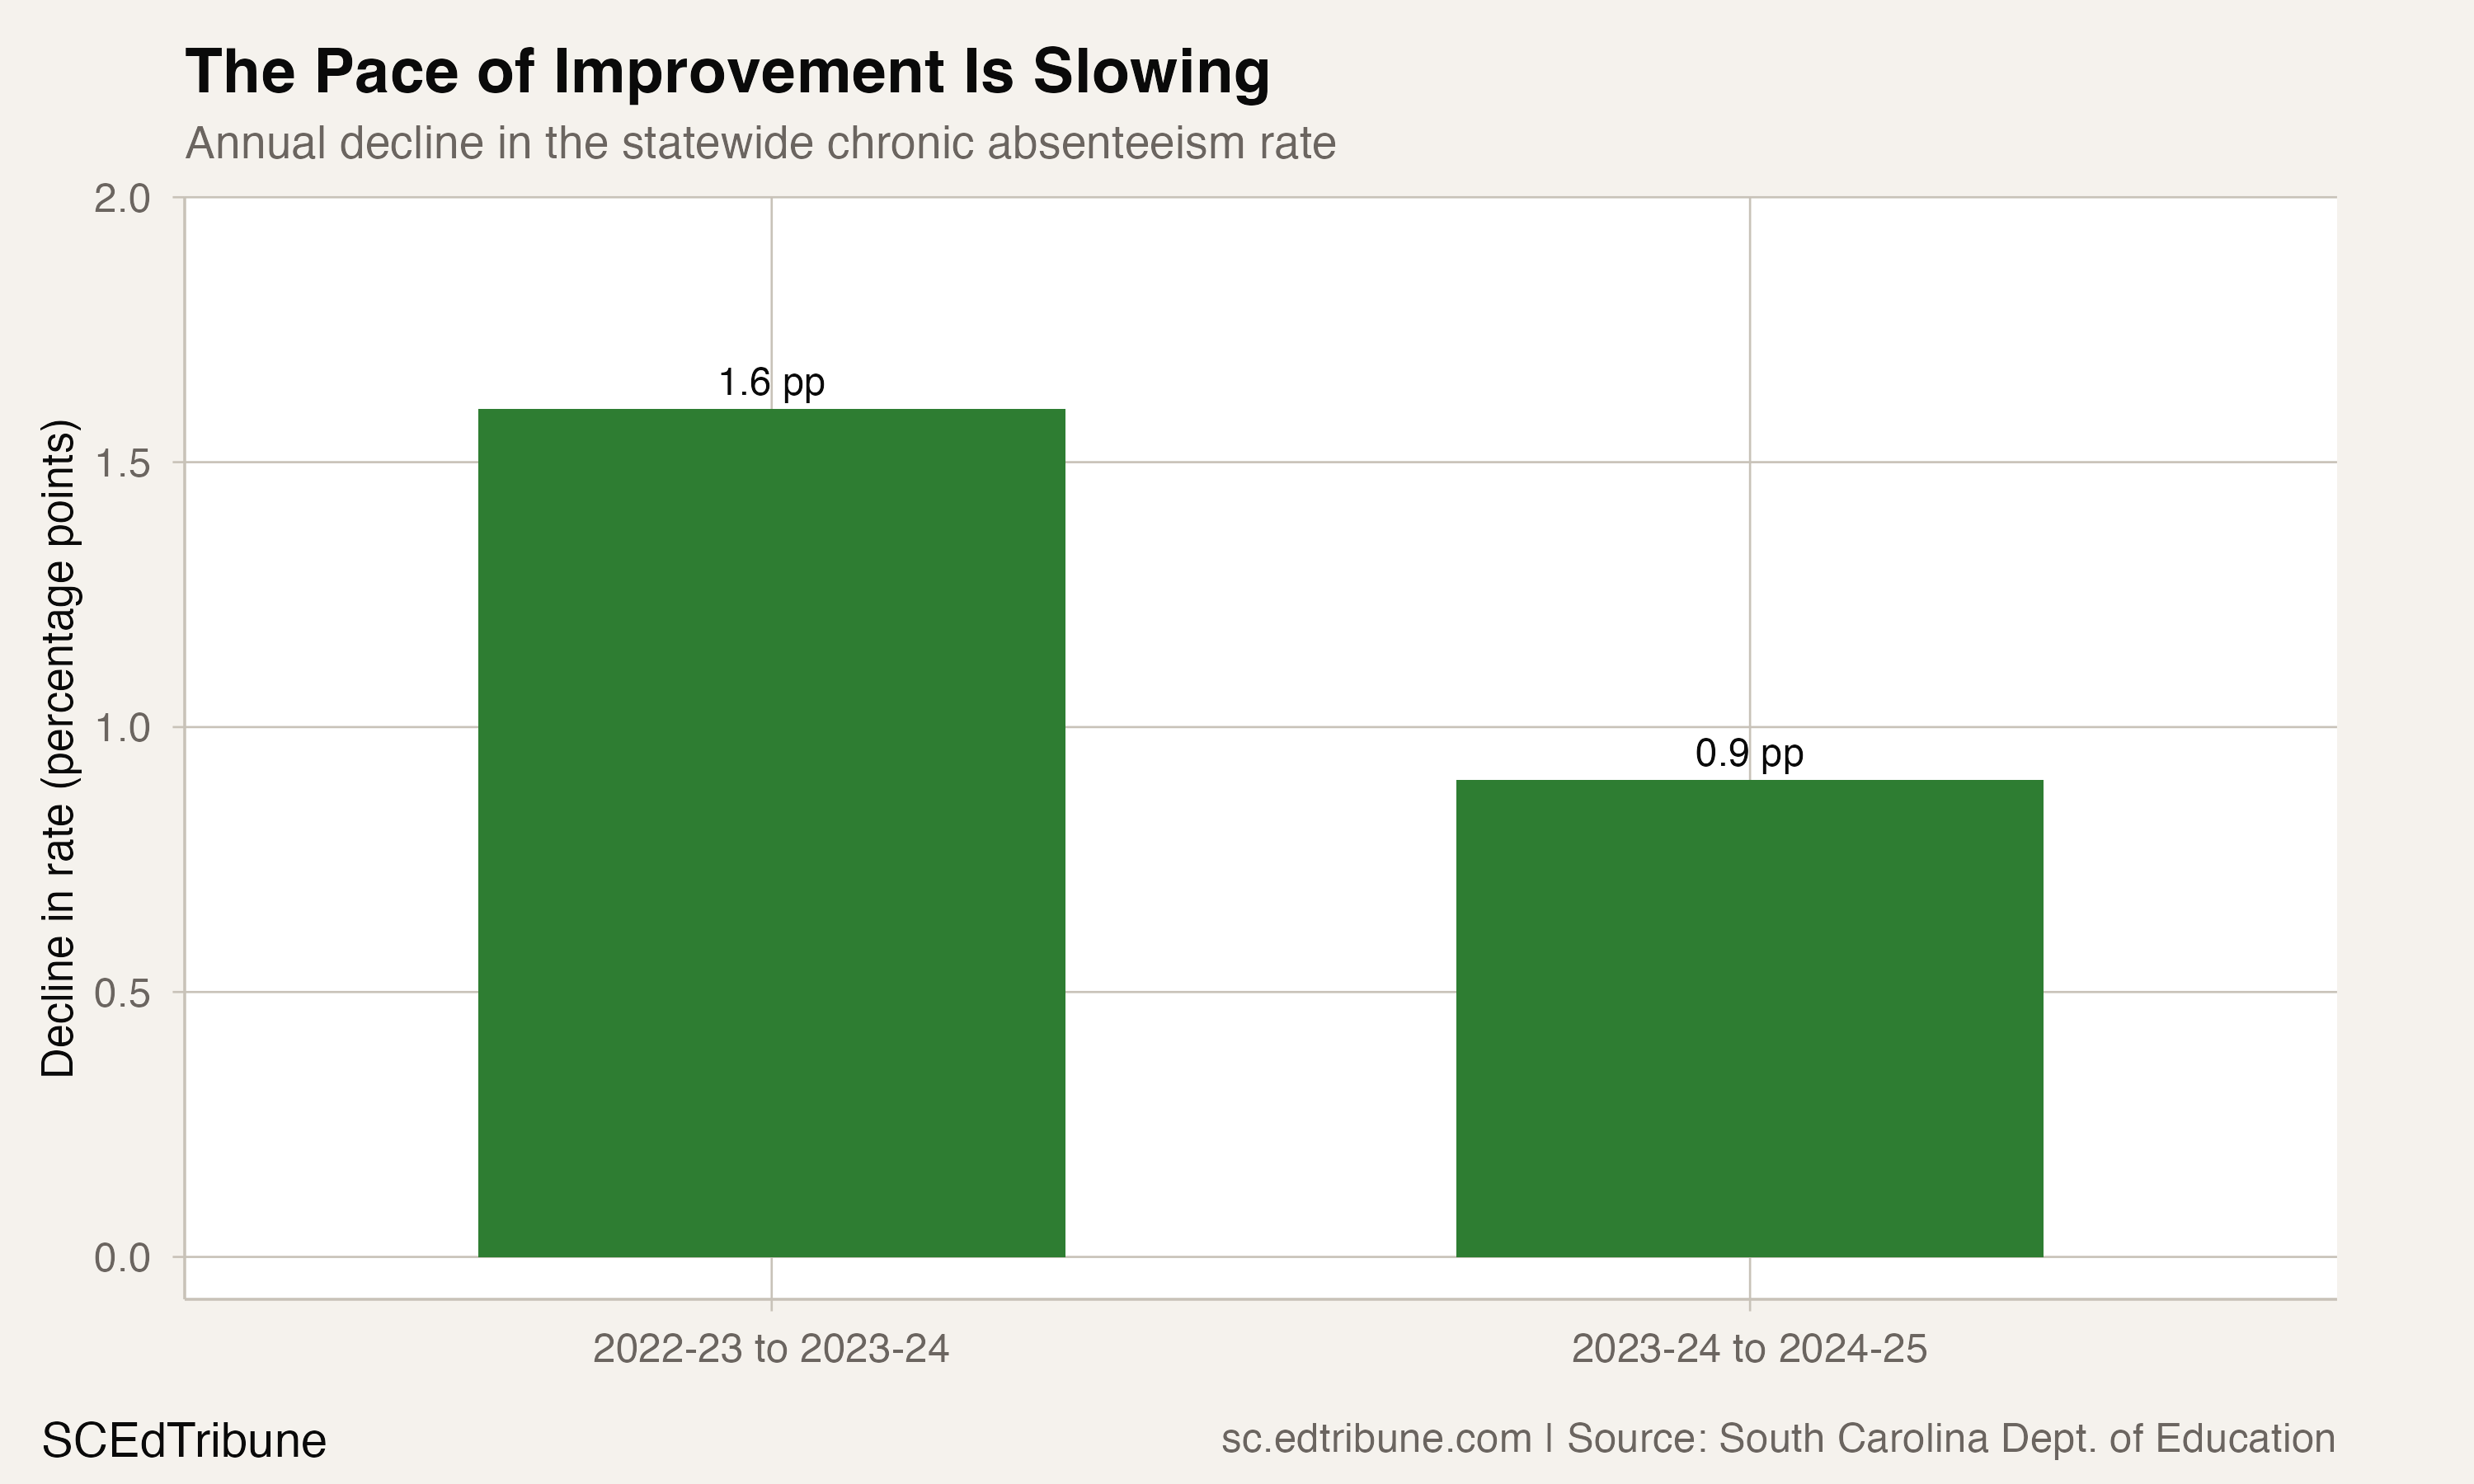
The statewide rate was 22.3%, based on a published denominator of 792,005 students. The rate was below 23.2% in 2023-24 and the four-year peak of 24.8% in 2022-23. But the year-over-year improvement slowed from 1.6 percentage points to 0.9 points. The package series used for this analysis begins in 2021-22, so it does not establish a pre-pandemic baseline.
The decline continued at a slower pace
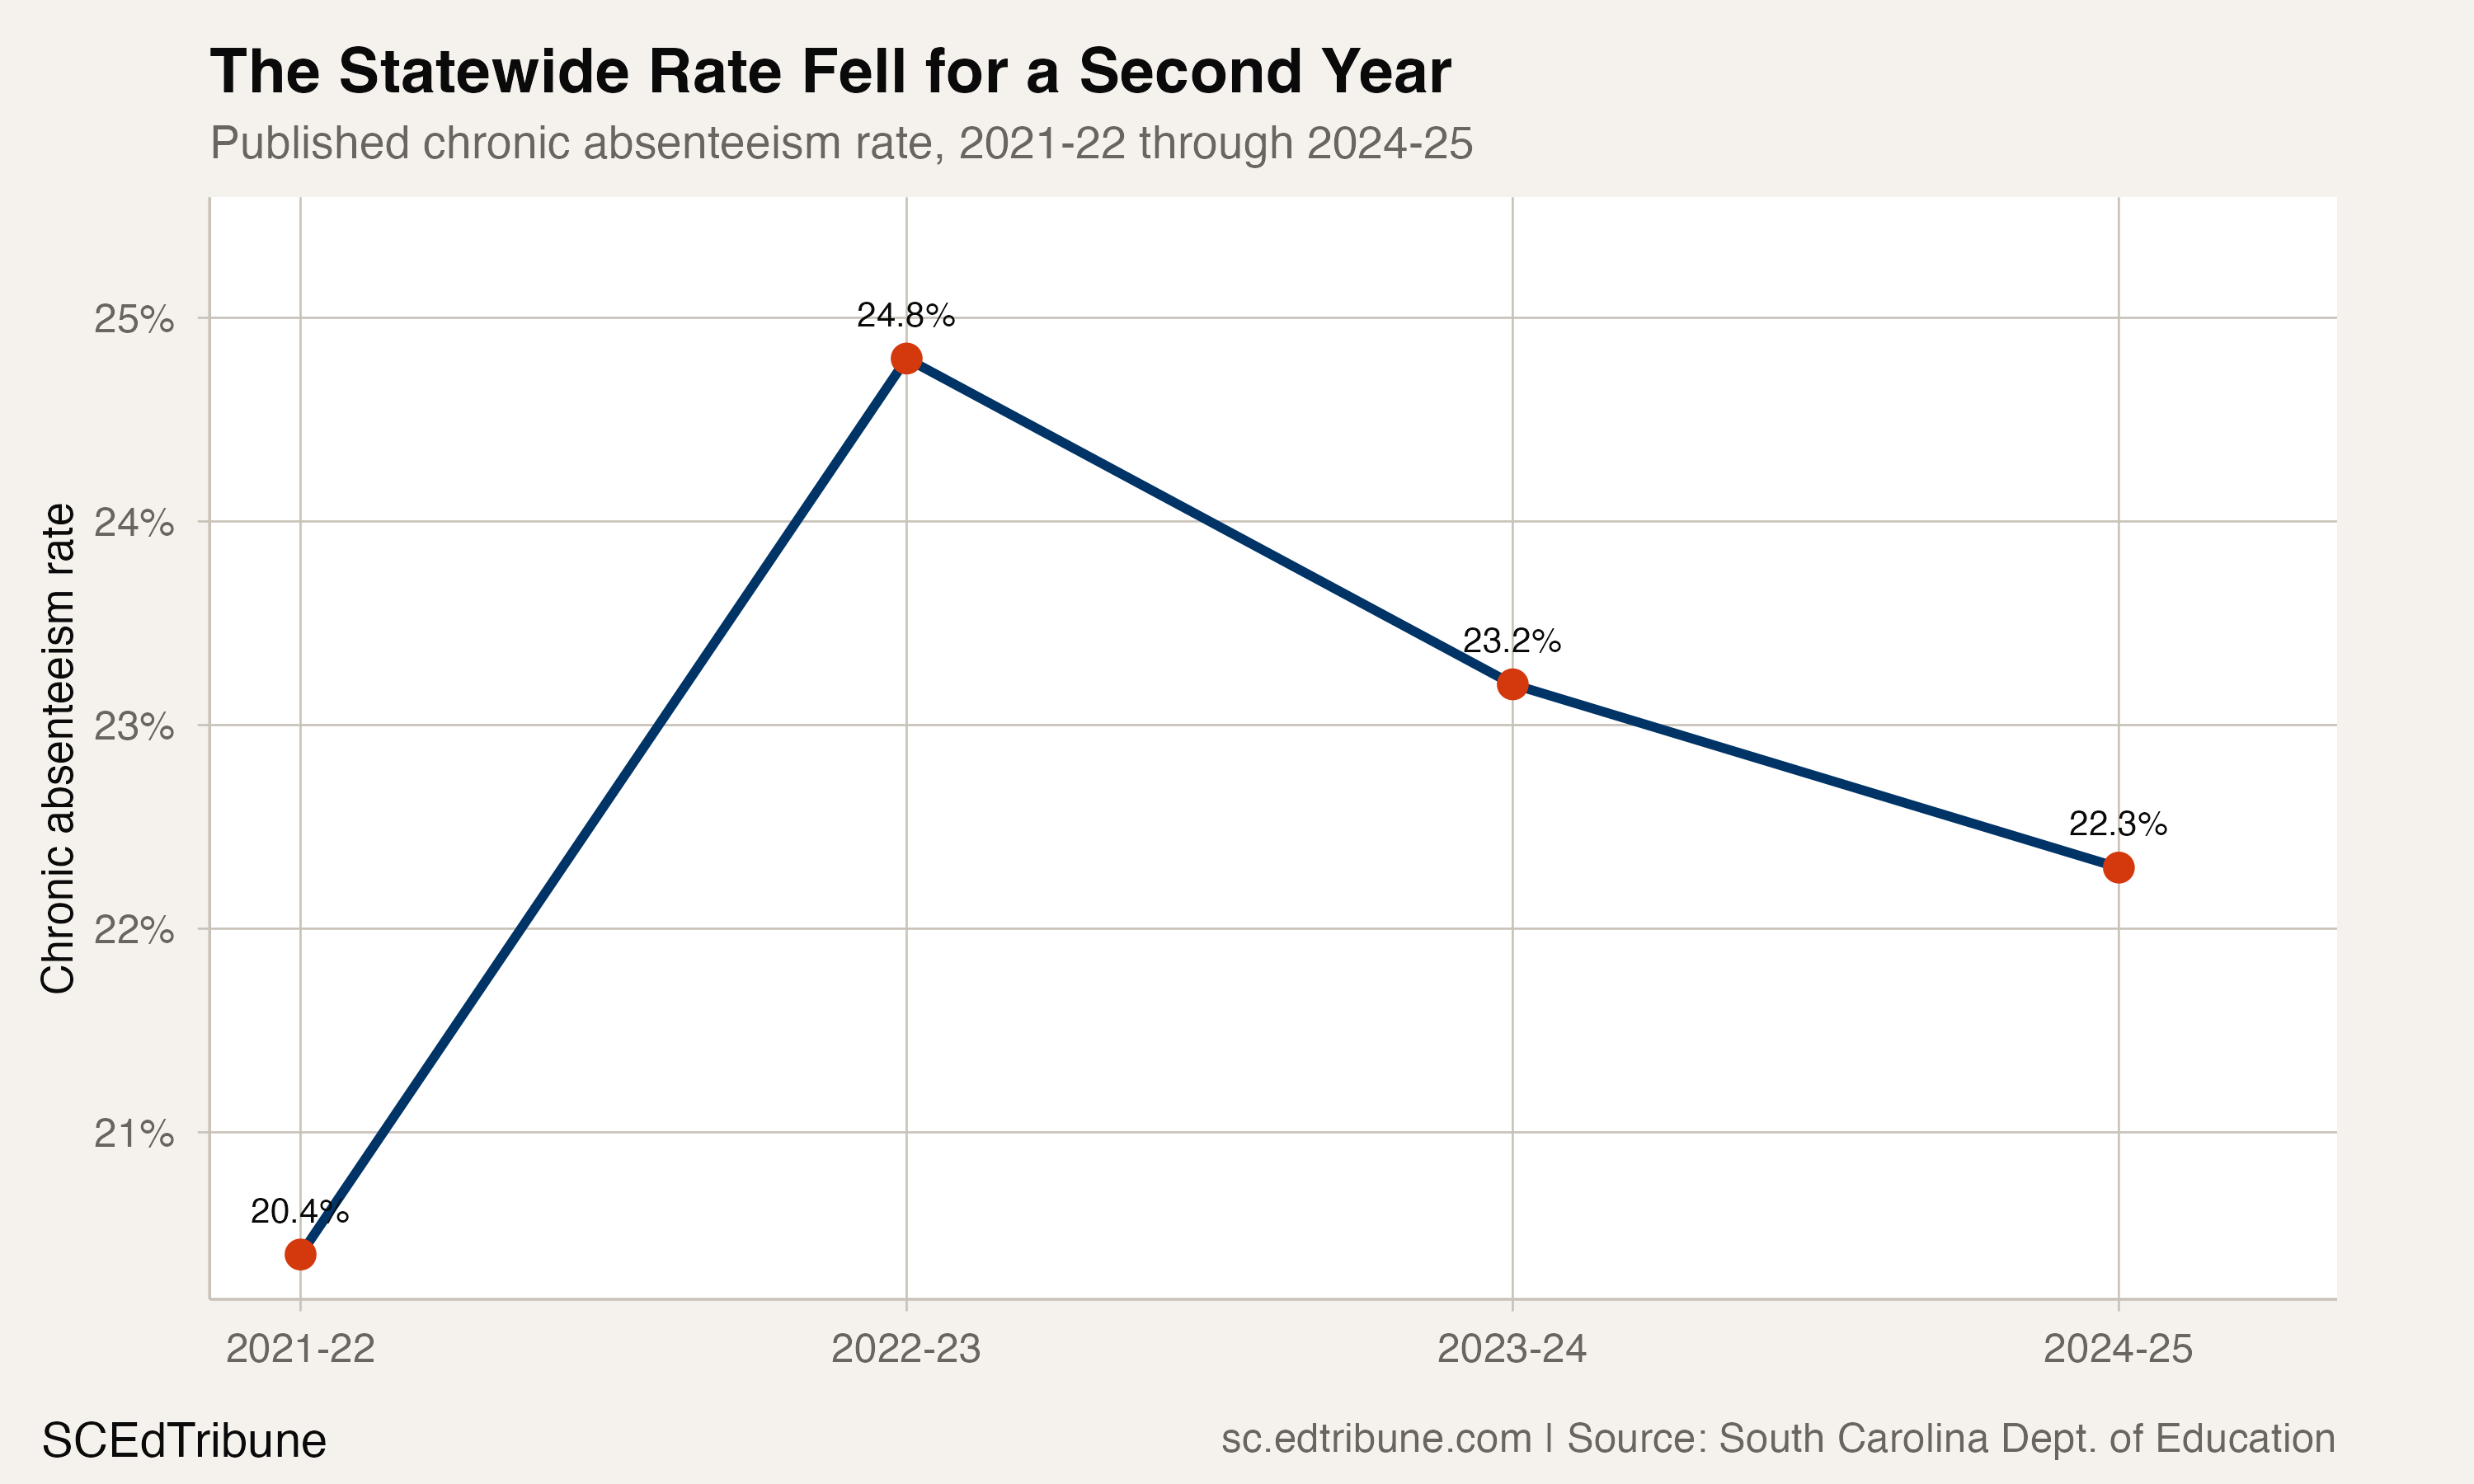
At 22.3%, the latest published rate is about one in every 4.5 students. The annual figures show direction and pace; they do not identify which students changed attendance patterns or why. The smaller statewide decline therefore should not be read as evidence that one type of student has returned while another has not.
Charleston County School District told The SCEdTribune in a written response that its work had shifted toward more targeted, student-level interventions. The local outreach record also says the district described mental-health counselors working with attendance teams so staff could respond to barriers behind an absence pattern. Those statements describe Charleston's approach, not a demonstrated cause of the statewide change.
Who is missing school
Rates varied substantially across the student groups in the published data.
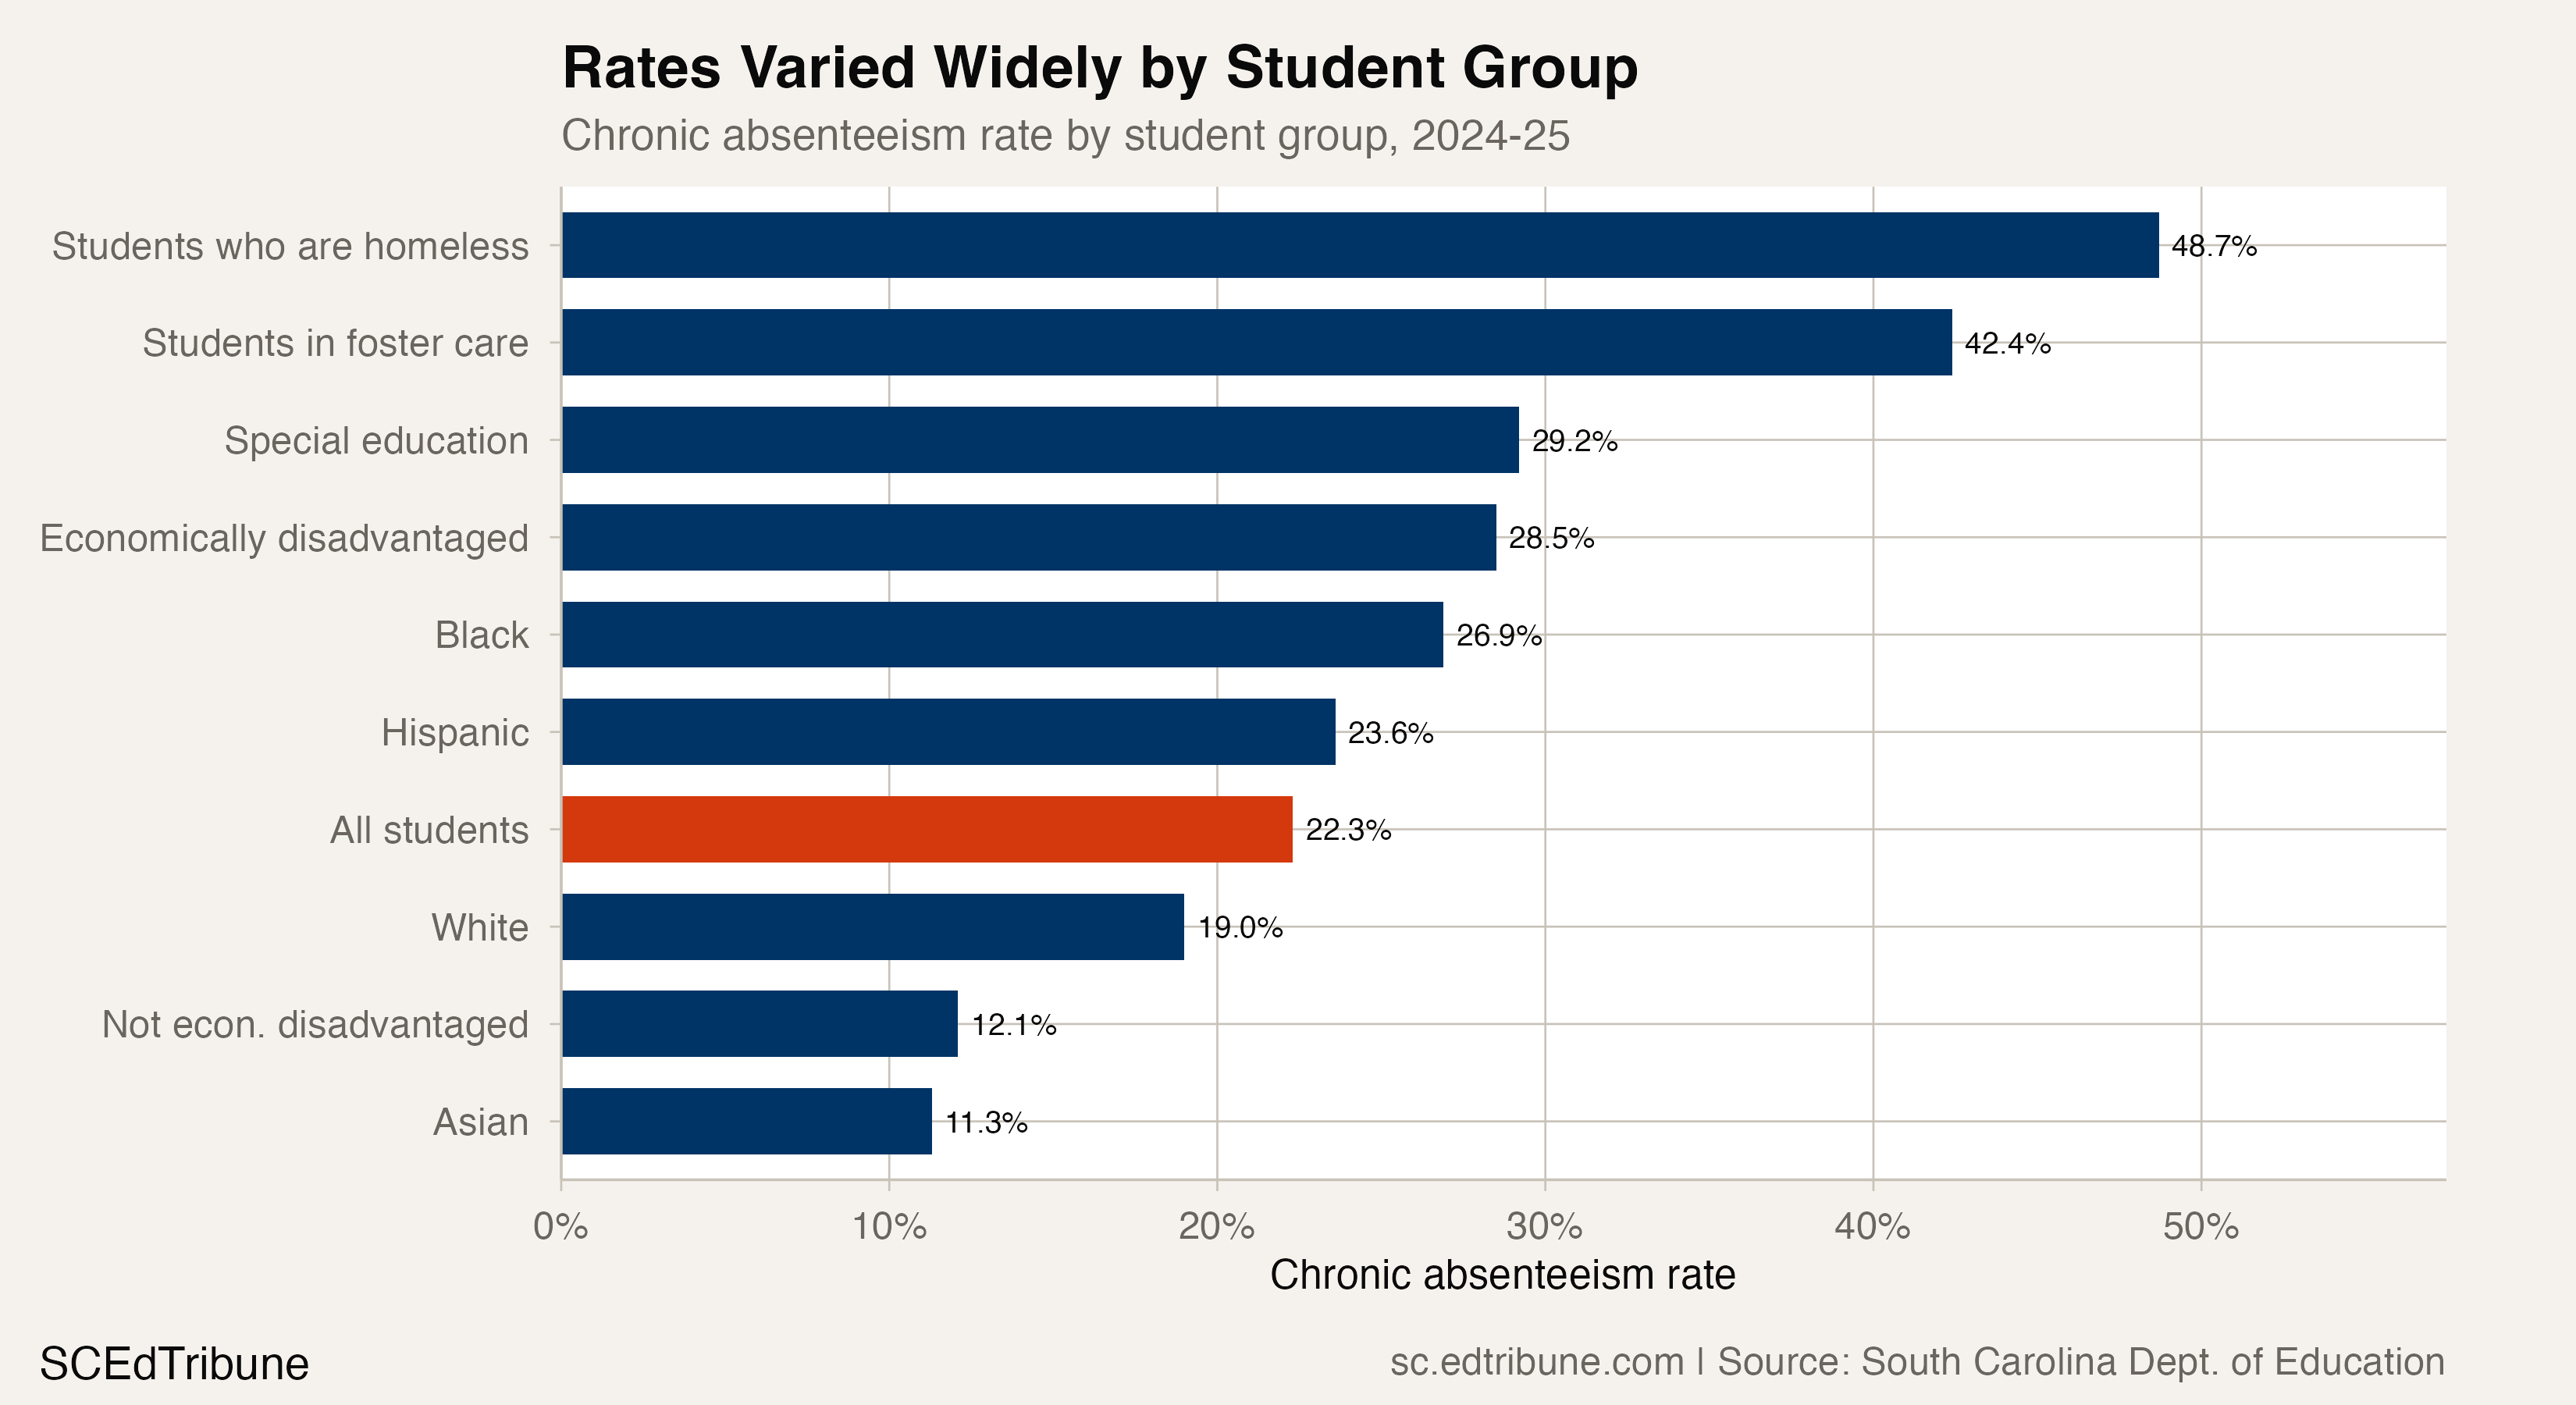
Students classified as homeless had the highest reported subgroup rate in 2024-25, at 48.7%. Students in foster care were at 42.4%, up from 29.0% in 2021-22 and higher in two of the series' three year-over-year transitions. Students in special education were at 29.2%, and economically disadvantaged students were at 28.5%. Asian students were at 11.3%, and students not classified as economically disadvantaged were at 12.1%.
The difference between economically disadvantaged students and students not classified that way ranged from 15.4 to 16.6 percentage points across the four published years. It was 16.4 points in 2024-25. The data establish that the gap persisted; they do not establish the mechanisms behind it.
176,344 students is a school system
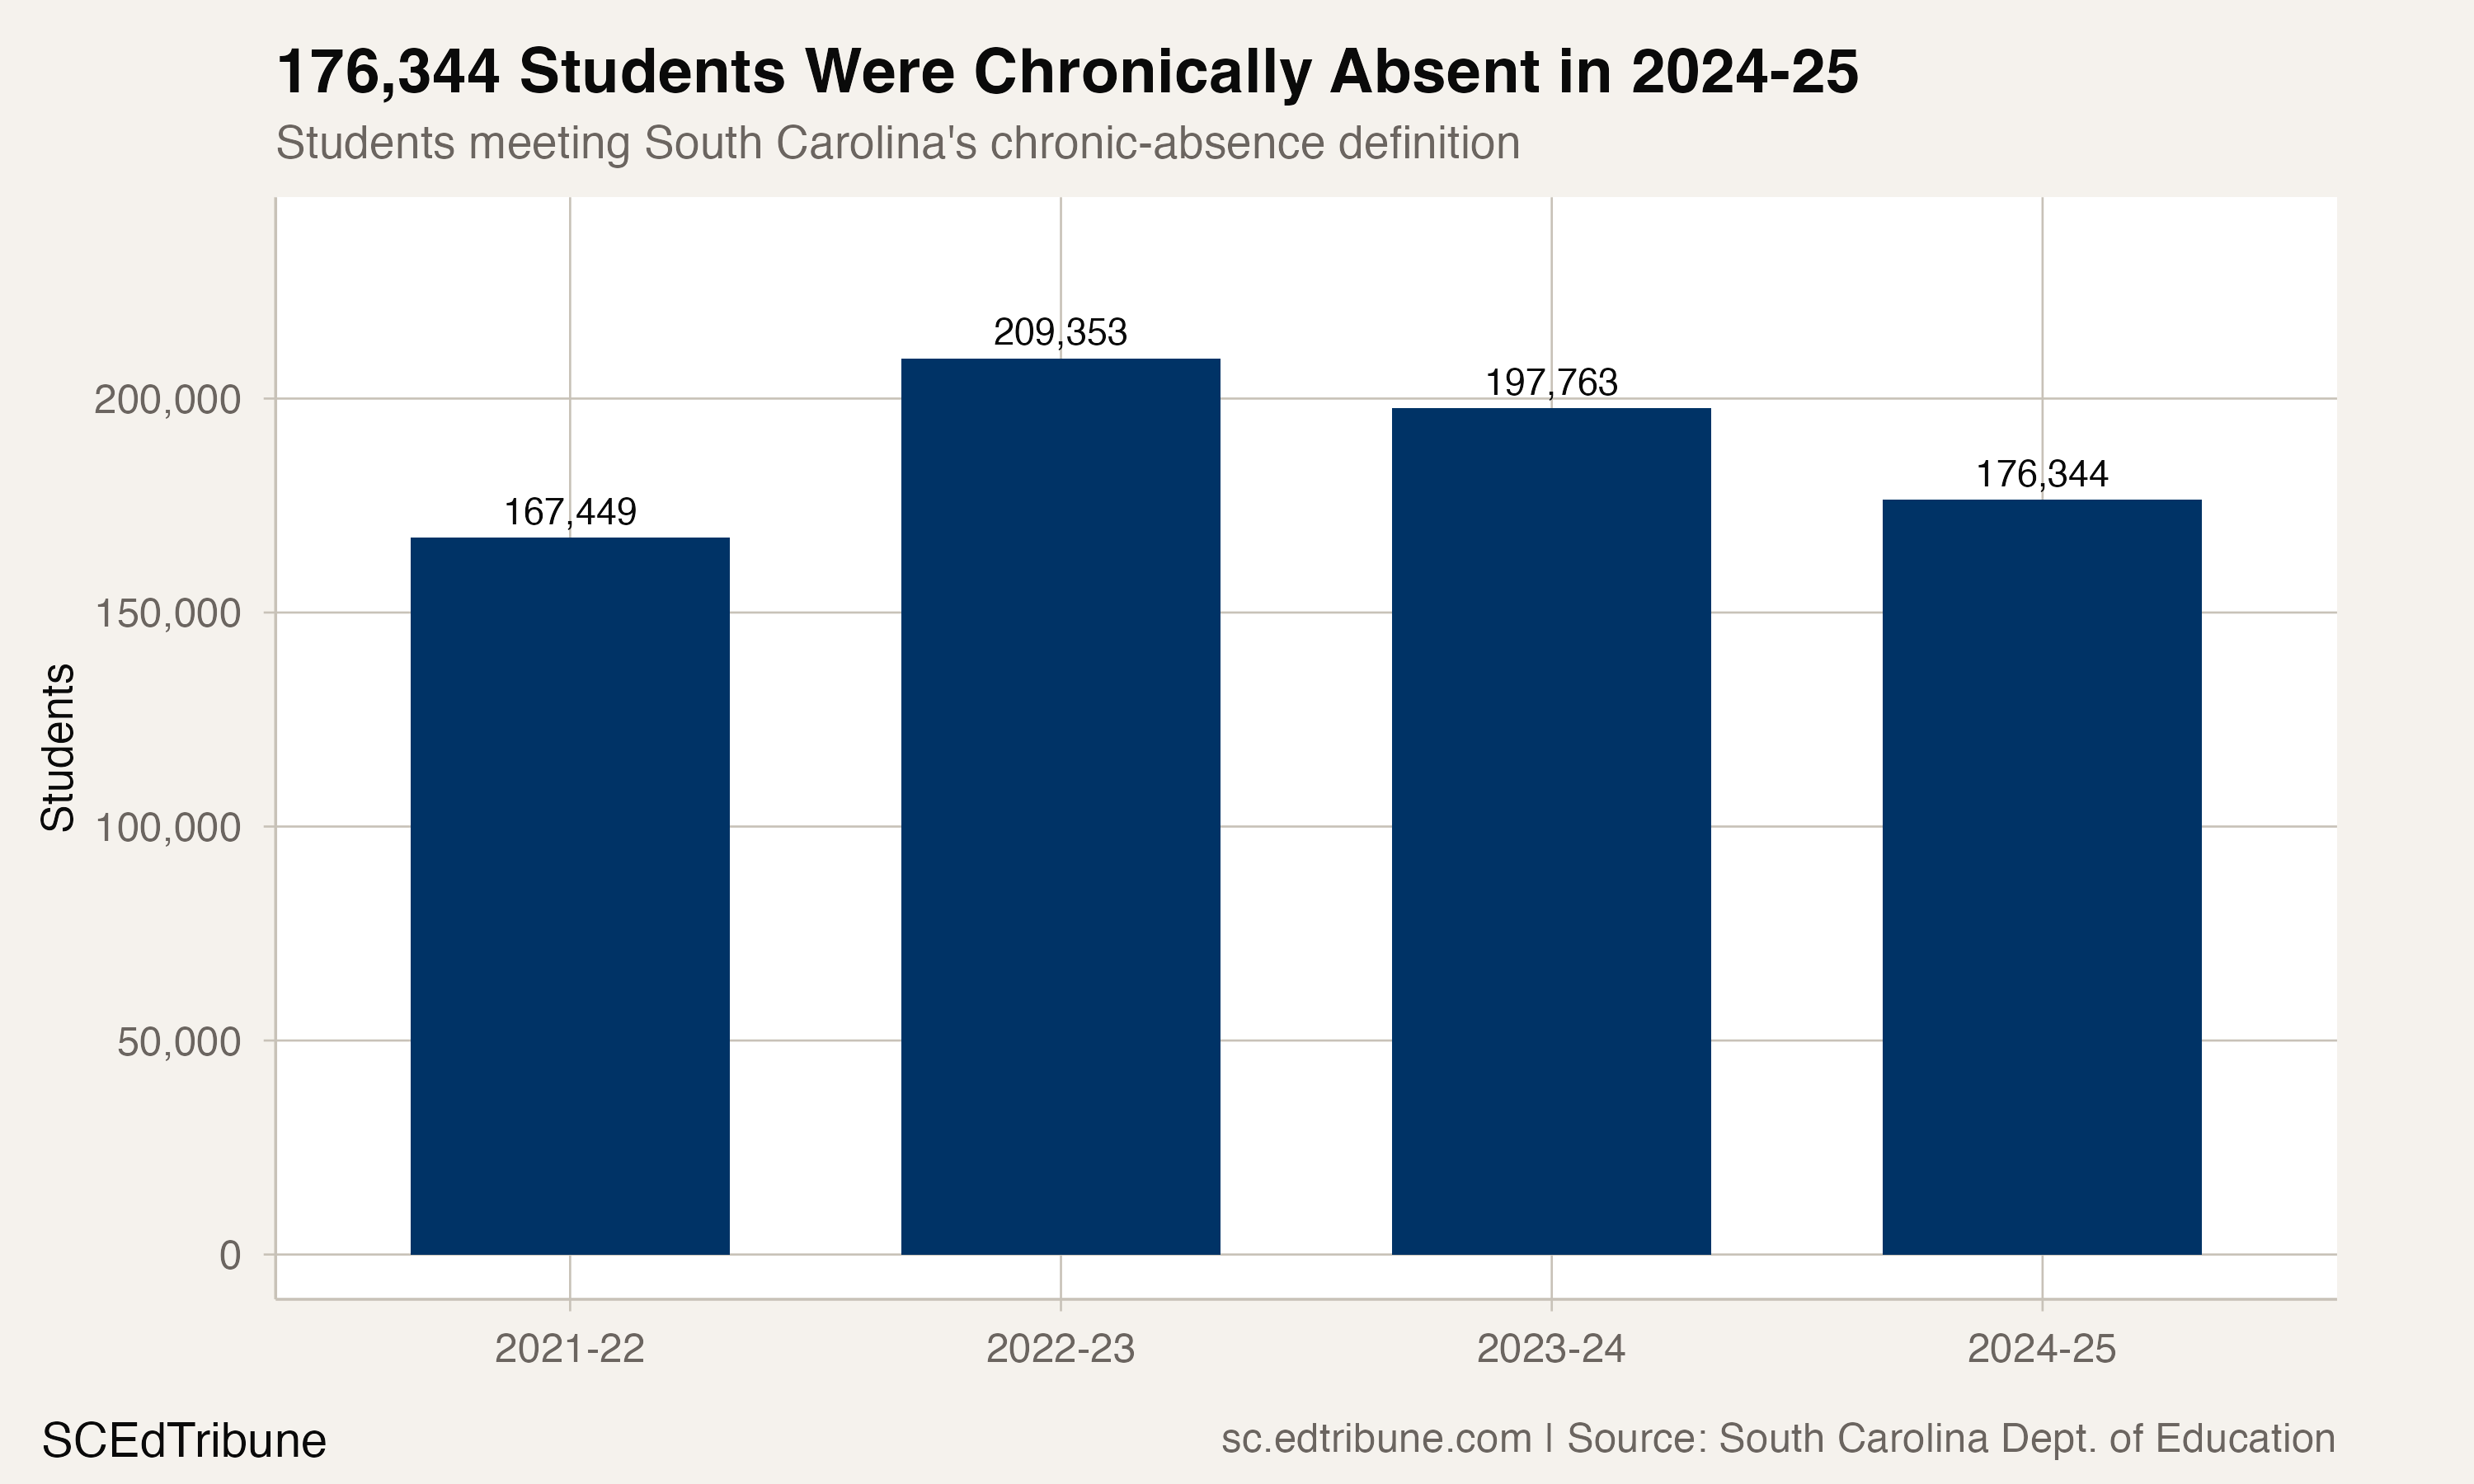
For scale, the three largest districts by 2024-25 enrollment were Greenville 01 with 77,774 students, Charleston 01 with 50,856, and Horry 01 with 48,662. Together they enrolled 177,292 students. The statewide chronically absent count was 948 lower than that combined enrollment.
Charleston's attendance incentive pilot
In spring 2025, Charleston County tested a weekly cash attendance incentive in selected grades. The payment was available when a student attended every day that week.
Charleston's written response to The SCEdTribune discussed the pilot's cost alongside the district's broader attendance spending. The two scopes should not be treated as an effectiveness comparison. The evidence available here does not establish that the incentive caused a change in attendance or academic results.
The statewide count fell by 33,009 students between the 2022-23 peak and 2024-25. That change is directly supported by the published series. Which students crossed the chronic-absence threshold, which interventions mattered, and whether the slower improvement will continue are not answered by the aggregate data.
Detailed code that reproduces the analysis and figures in this article is available exclusively to EdTribune subscribers.
Discussion
Sign in to join the discussion.
Loading comments...