Correction: An earlier draft overstated what the available data could explain. This version limits the story to verified attendance patterns and moves the article package to its July 21 publication path.
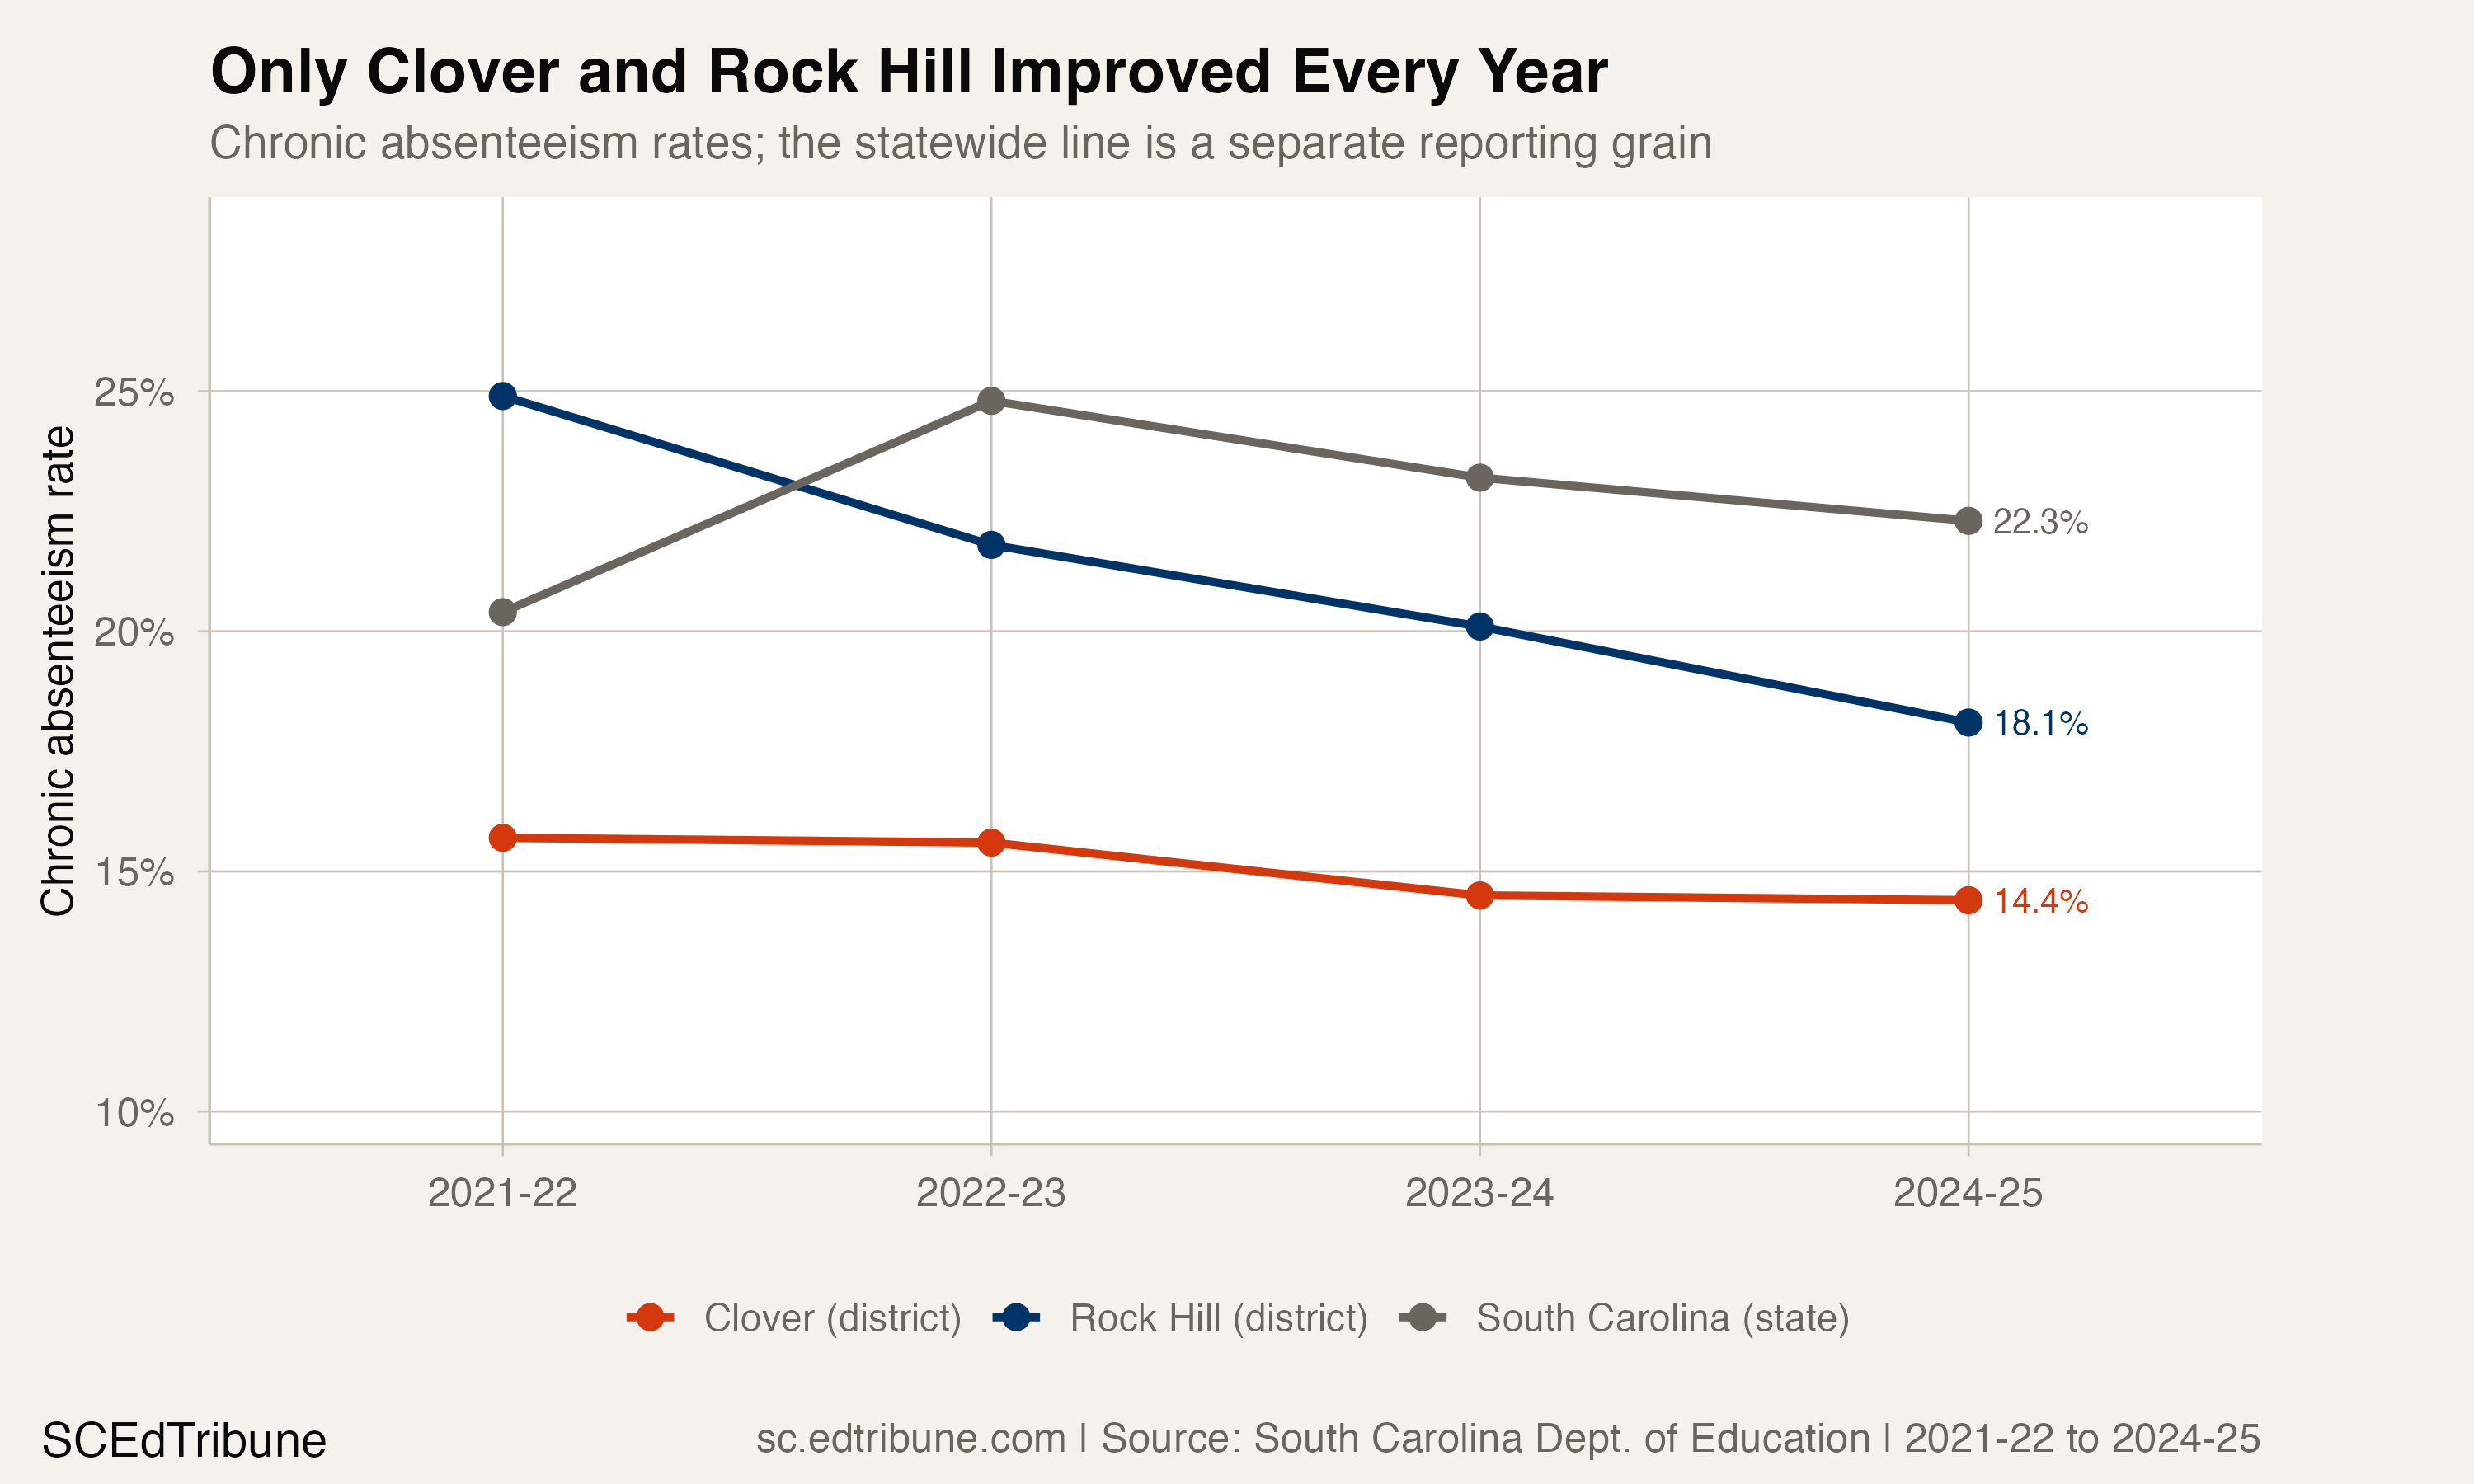
Across South Carolina's four available chronic-absence reporting years, Clover School District↗ET moved in one direction: 15.7% in 2021-22, 15.6% in 2022-23, 14.5% in 2023-24 and 14.4% in 2024-25. That is three consecutive annual declines across four reporting years.
Only Rock Hill↗ET matched that uninterrupted pattern among 77 district-level entities with complete records under a stable ID. Rock Hill fell from 24.9% to 18.1% over the same period. The statewide rate followed a different path, rising from 20.4% to a 24.8% peak in 2022-23 before declining to 22.3% in 2024-25.
A Narrow but Durable Signal
The South Carolina data available for this analysis begin in 2021-22, so Clover's streak is an available-panel finding, not an all-time claim. The 2021-22 record also used a longer version of the district's name. Its stable ID connects that observation to the next three reporting years.
The result is still selective. Forty-four of 80 district-level entities with two latest-year observations improved from 2023-24 to 2024-25. Eighteen of 80 improved in each of the latest two annual transitions. Requiring a third adjacent decline reduces the complete comparison universe to 77 entities and the qualifying group to Clover and Rock Hill.
Clover's Large-Entity Peer Set
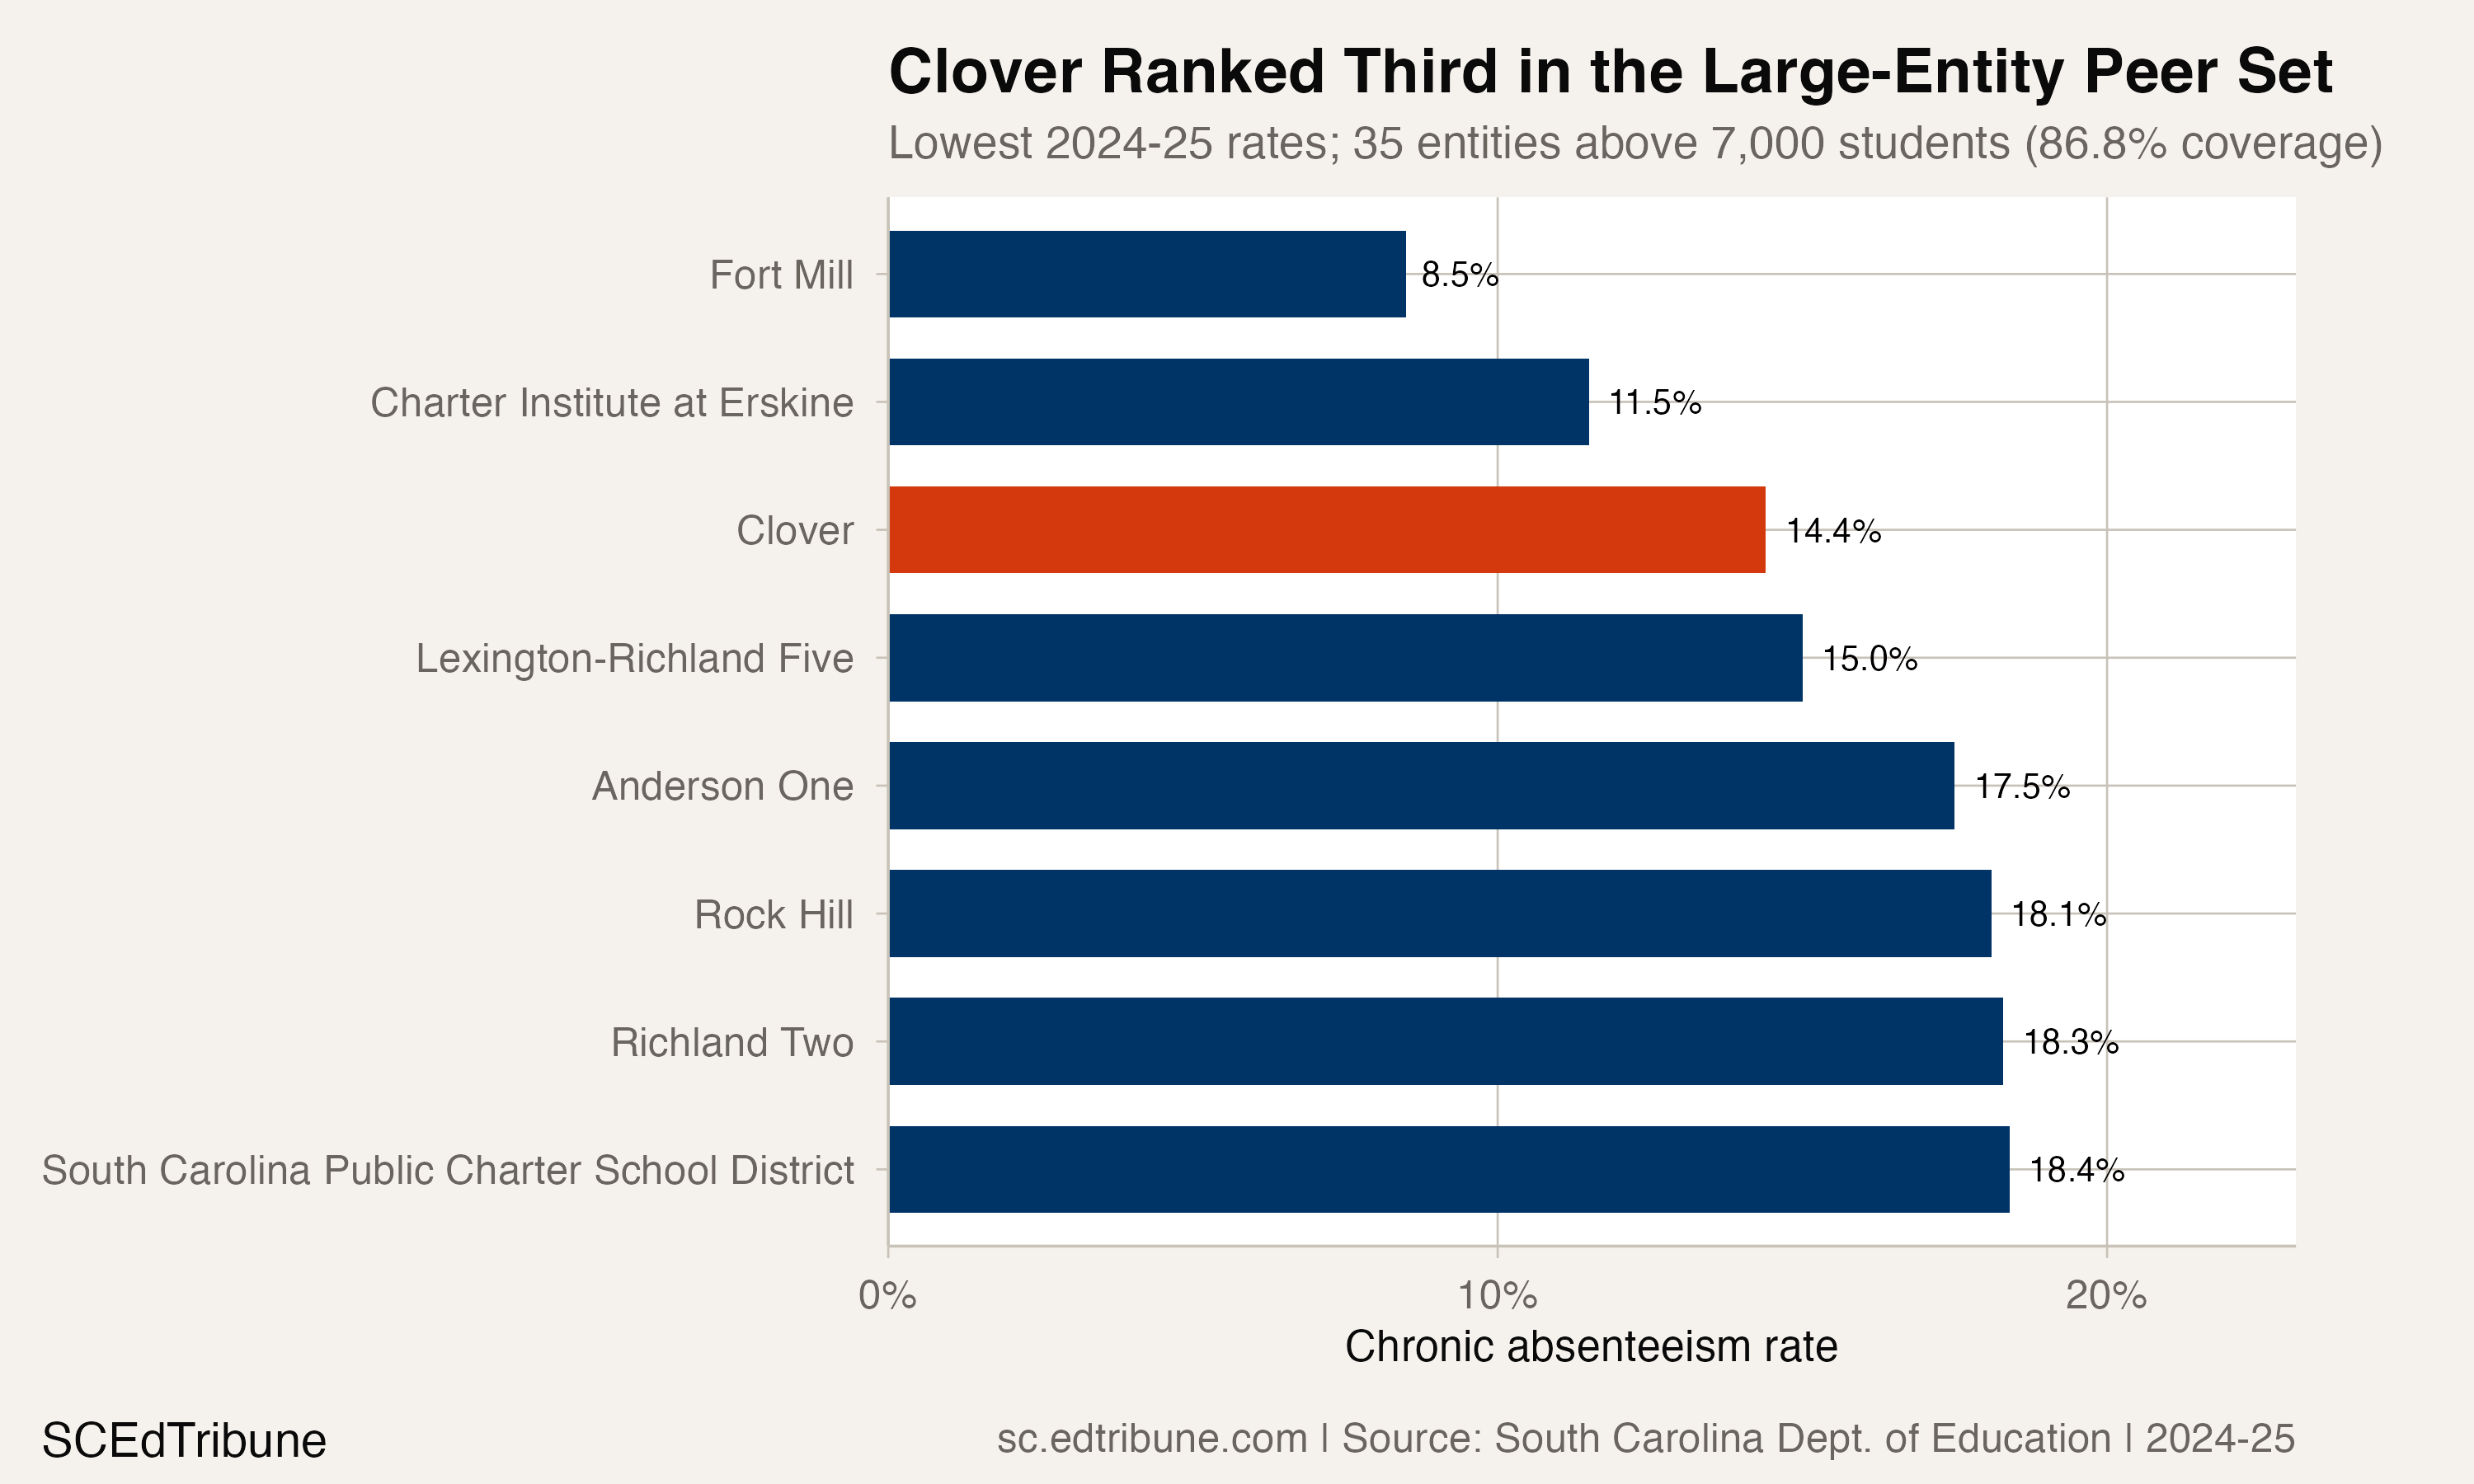
Among 35 district-level entities with more than 7,000 students in their 2024-25 attendance denominator, Clover's 14.4% rate ranked third-lowest. Fort Mill↗ET was at 8.5%, and the Charter Institute at Erskine↗ET was at 11.5%.
The 7,000-student threshold is an editorial cutoff, not a state classification. It covers 86.8% of enrollment in the 77-entity complete comparison universe. Clover's rate had no tie in that peer set.
The District Total Does Not Describe Every Group
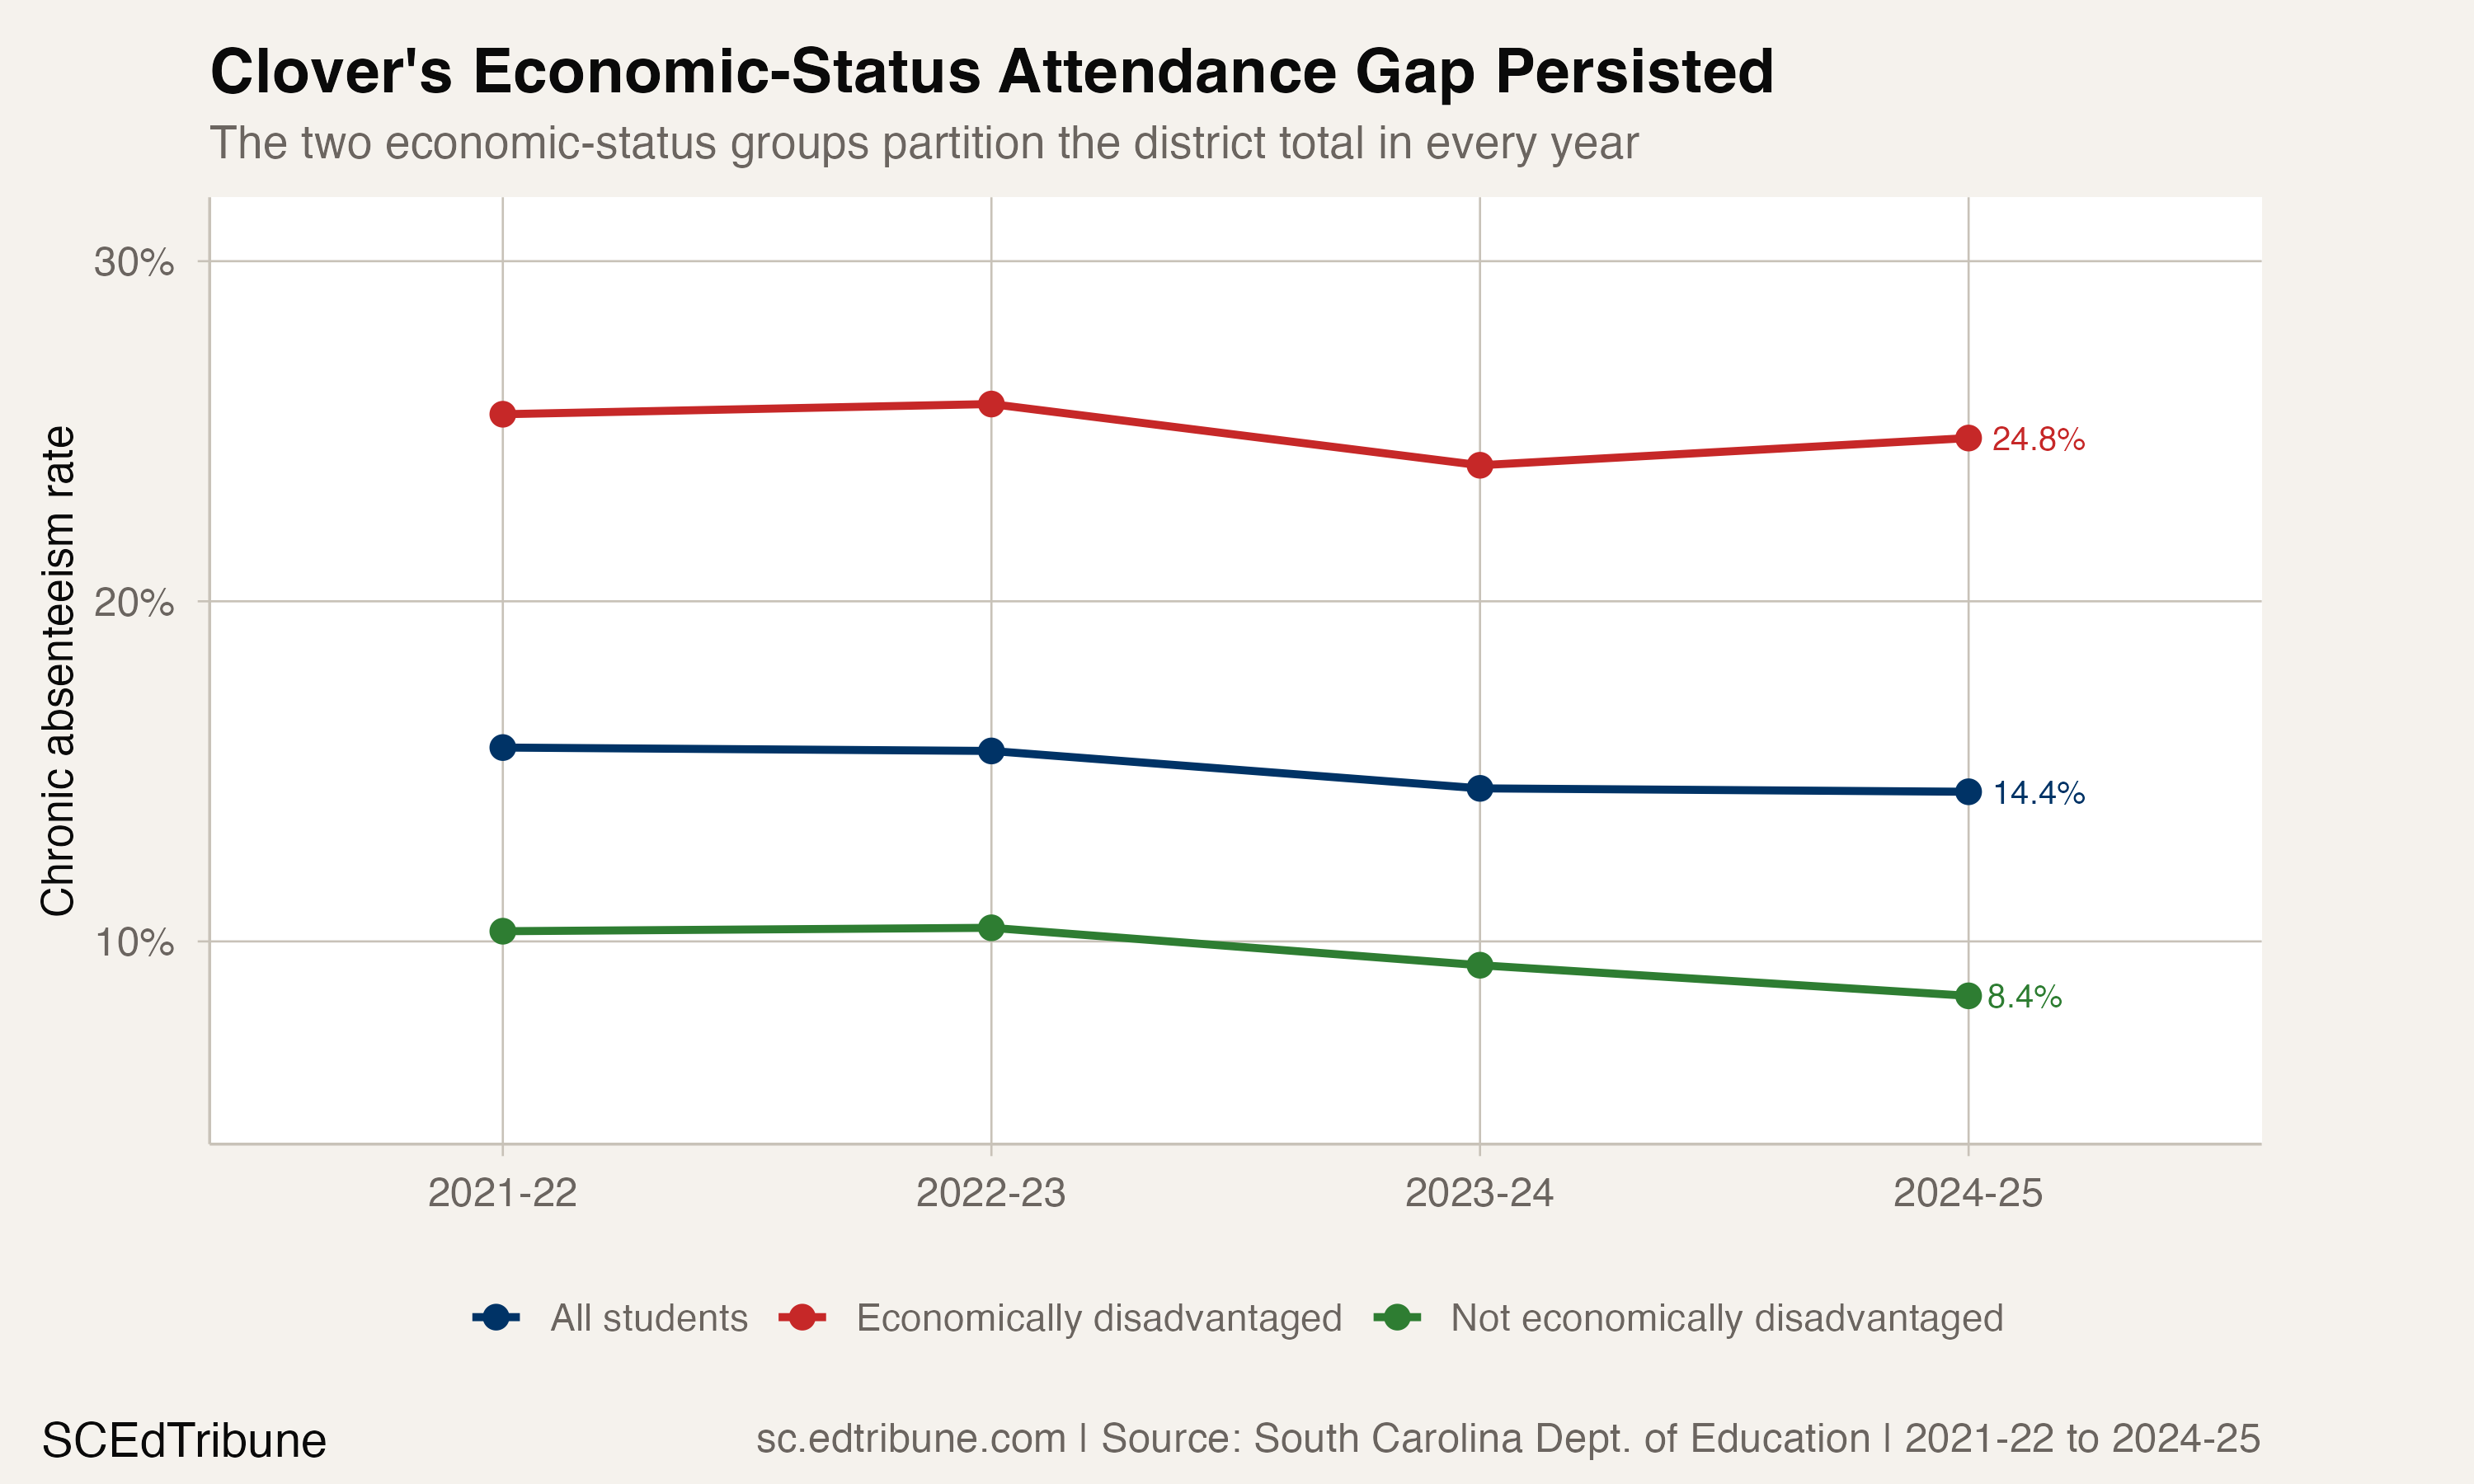
Clover's districtwide decline coexists with a large economic-status difference. In 2024-25, the chronic absenteeism rate was 24.8% among 3,313 students classified as economically disadvantaged and 8.4% among 5,785 students not classified that way. The gap was 16.4 percentage points.
Those two economic-status groups reconcile exactly to Clover's enrollment and chronically absent counts in each reporting year. They are kept separate from race and ethnicity comparisons because economic status can overlap those categories.
The total rate does not identify why Clover improved. The dataset does not report local attendance interventions or isolate their effects, so attributing the decline to a district policy or community characteristic would be unresourced. Differences in student composition or local barriers remain competing explanations that this descriptive record cannot test.
In 2024-25, Clover enrolled 9,098 students and reported 1,308 who were chronically absent. Its overall rate was 1.3 percentage points lower than in 2021-22, but the economic-status gap remained much larger than the total change. Clover's four-year record is a consistent observed improvement, not an explanation for how to reproduce it.
South Carolina Department of Education chronic absenteeism data for 2021-22 through 2024-25. The department's chronic absenteeism page provides the official measure and reporting context.
Detailed code that reproduces the analysis and figures in this article is available exclusively to EdTribune subscribers.
Discussion
Sign in to join the discussion.
Loading comments...