Abbeville County School District↗ET is the namesake plaintiff in South Carolina's landmark school funding lawsuit. For two decades, "Abbeville" has been shorthand for the state's failure to adequately fund its poorest districts, a symbol of what goes wrong when rural communities are left behind.
The chronic absenteeism data tells a different story.
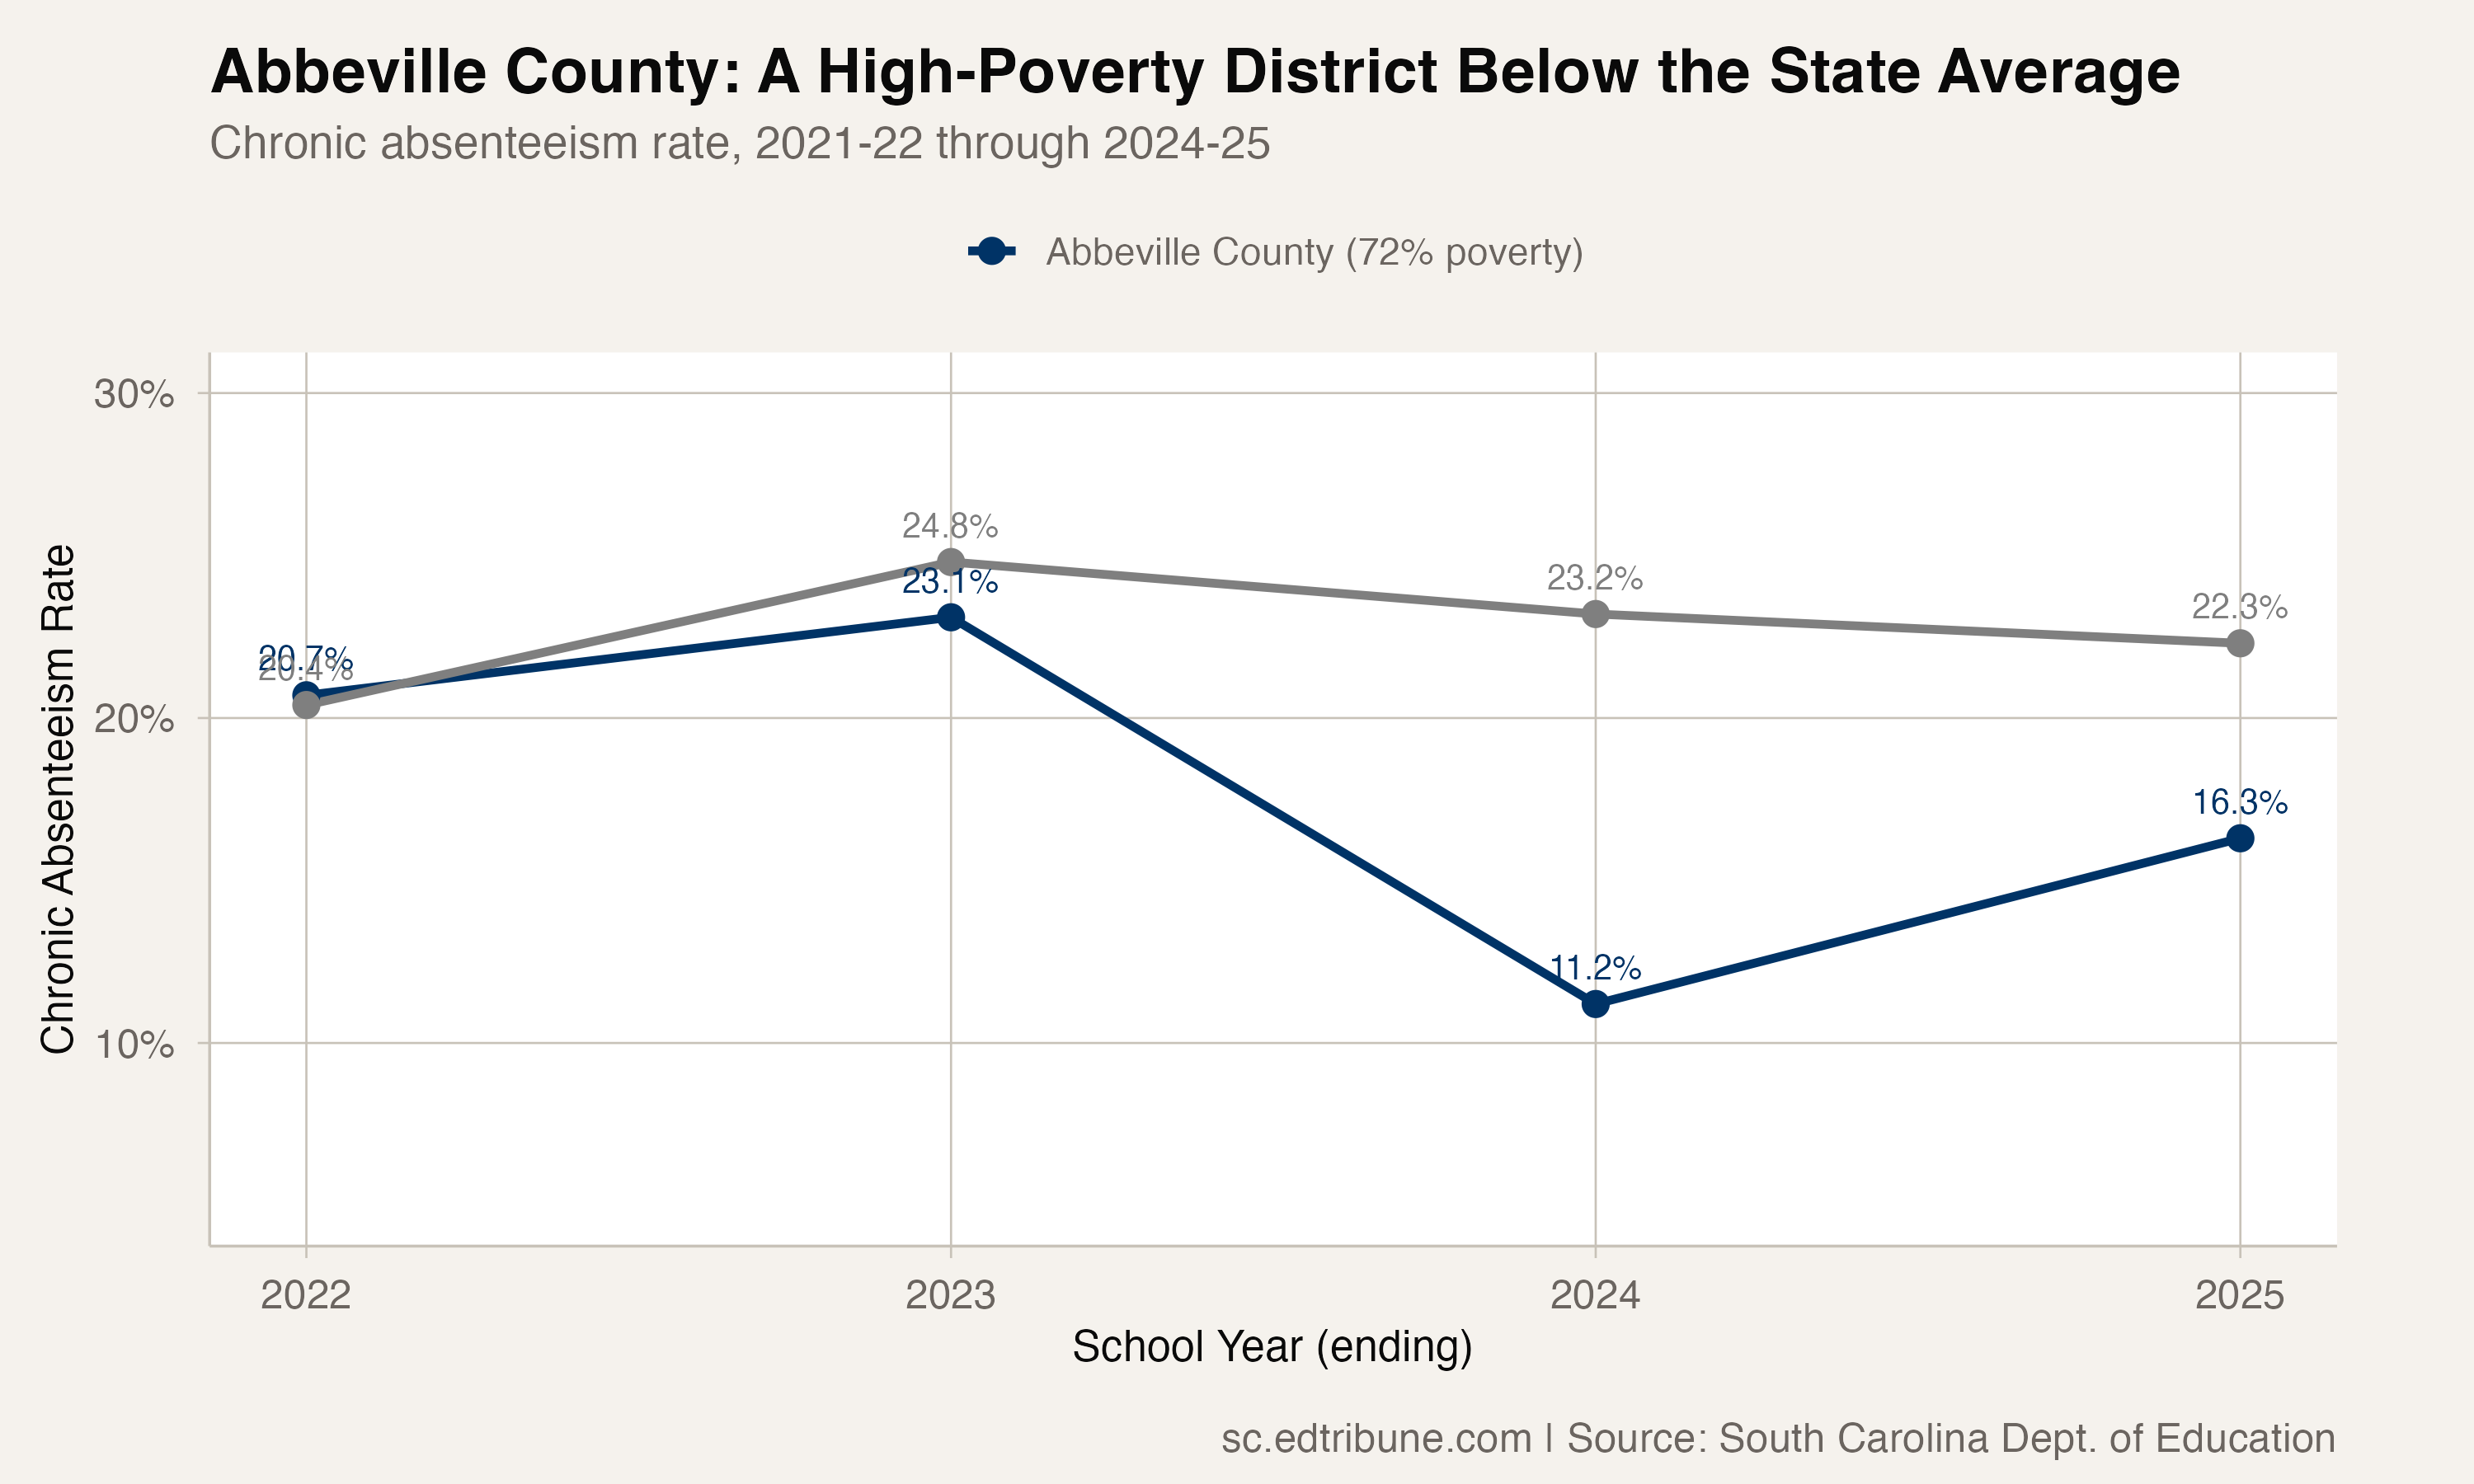
At 16.3% in 2024-25, Abbeville's chronic rate is 6 percentage points below the state average of 22.3%. It is lower than Dorchester Two (24.0%), Richland Two (18.3%), and most of the suburban districts that have far more resources per student. Seventy-two percent of Abbeville's students are economically disadvantaged. Among high-poverty districts statewide (those above 60% economically disadvantaged) the average chronic rate is 23.8%. Abbeville is 7.5 points better than its poverty tier.
The Numbers in Context
Abbeville's trajectory across the four years of available data is not a straight line. The district spiked from 20.7% to 23.1% during the 2022-23 post-COVID attendance crisis, then produced a remarkable 11.2% in 2023-24, roughly half the state average and a rate that would be exceptional for any district at any poverty level. Then, in 2024-25, it rebounded to 16.3%.
The 2024 result was extraordinary. The 2025 rebound means it probably was not sustainable. But even after the rebound, Abbeville remains below the state average and well below the high-poverty tier average.
| Student Group | 2021-22 | 2022-23 | 2023-24 | 2024-25 |
|---|---|---|---|---|
| All Students | 20.7% | 23.1% | 11.2% | 16.3% |
| Black | 23.4% | 27.8% | 14.7% | 18.6% |
| White | 19.2% | 20.8% | 9.4% | 14.7% |
| Econ. Disadvantaged | 25.3% | 27.7% | 13.7% | 20.3% |
Source: SC Department of Education, 2021-22 through 2024-25
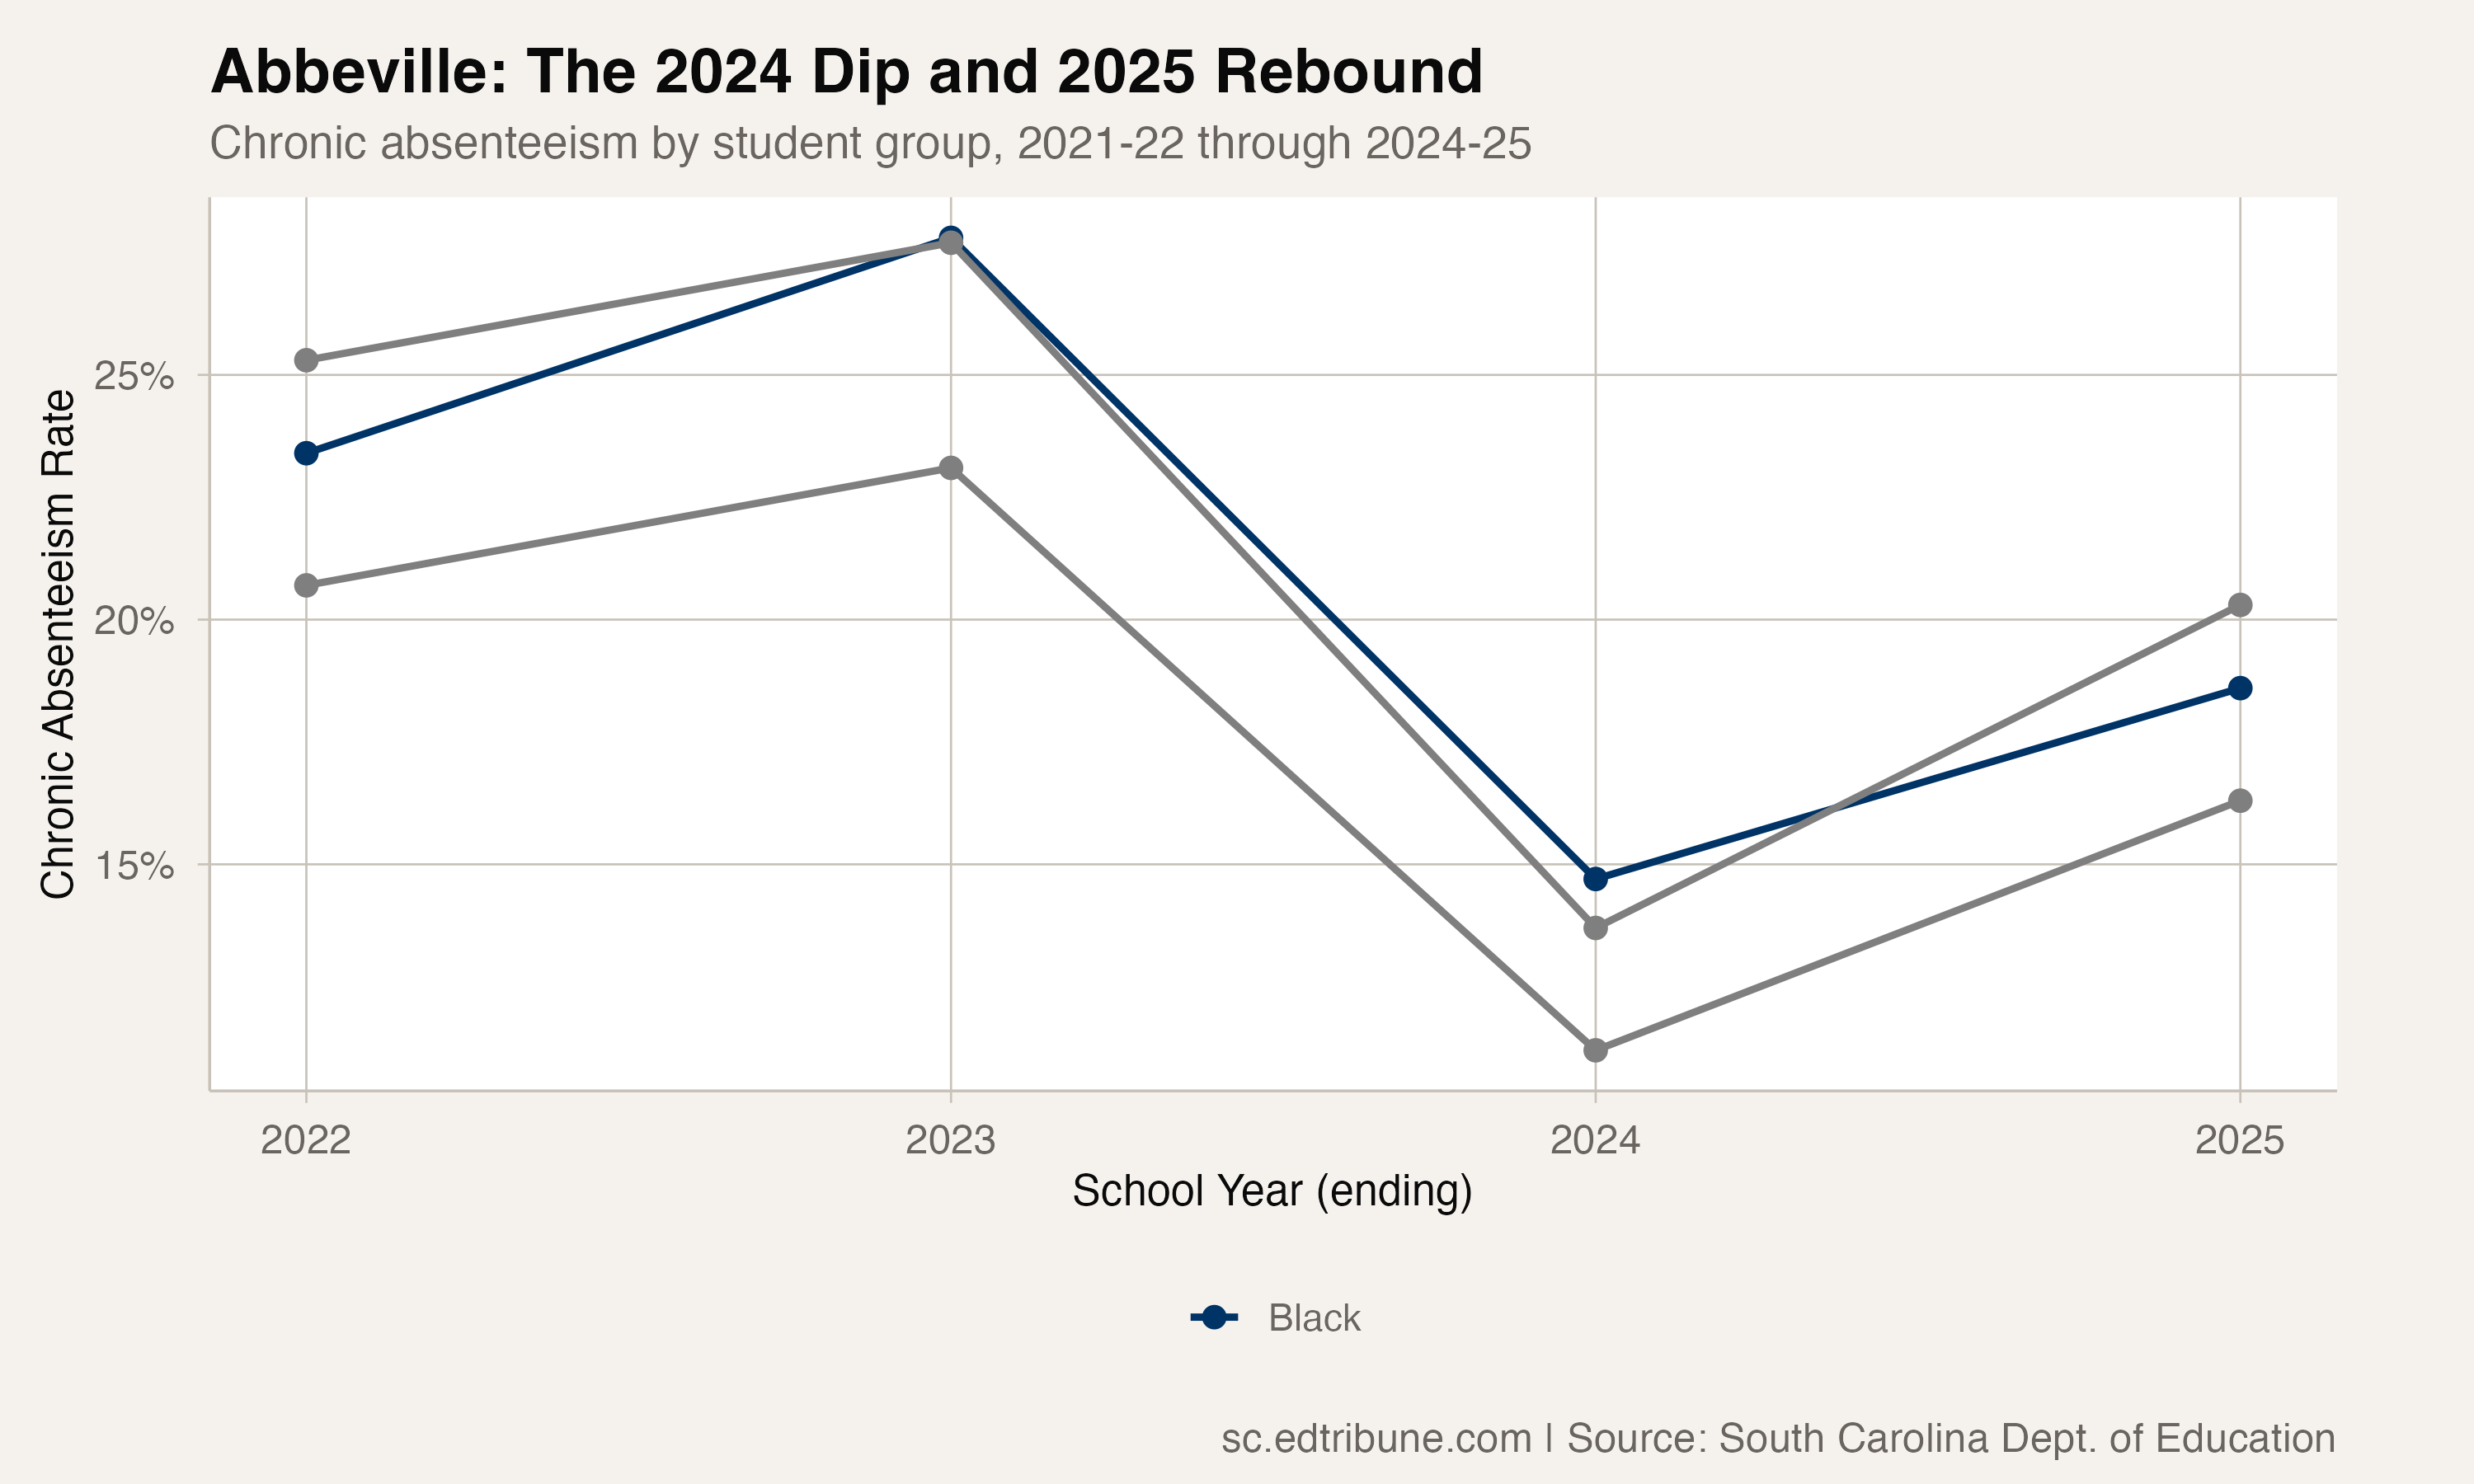
The subgroup data follows the same pattern: all groups improved substantially from the 2022-23 peak, all had remarkable 2023-24 results, all rebounded in 2024-25 but remain below their starting points. Black students went from 27.8% to 18.6%. Economically disadvantaged students went from 27.7% to 20.3%.
Beating Wealthier Districts
The comparison that jumps out of the data is between Abbeville and districts with significantly more resources and less poverty.
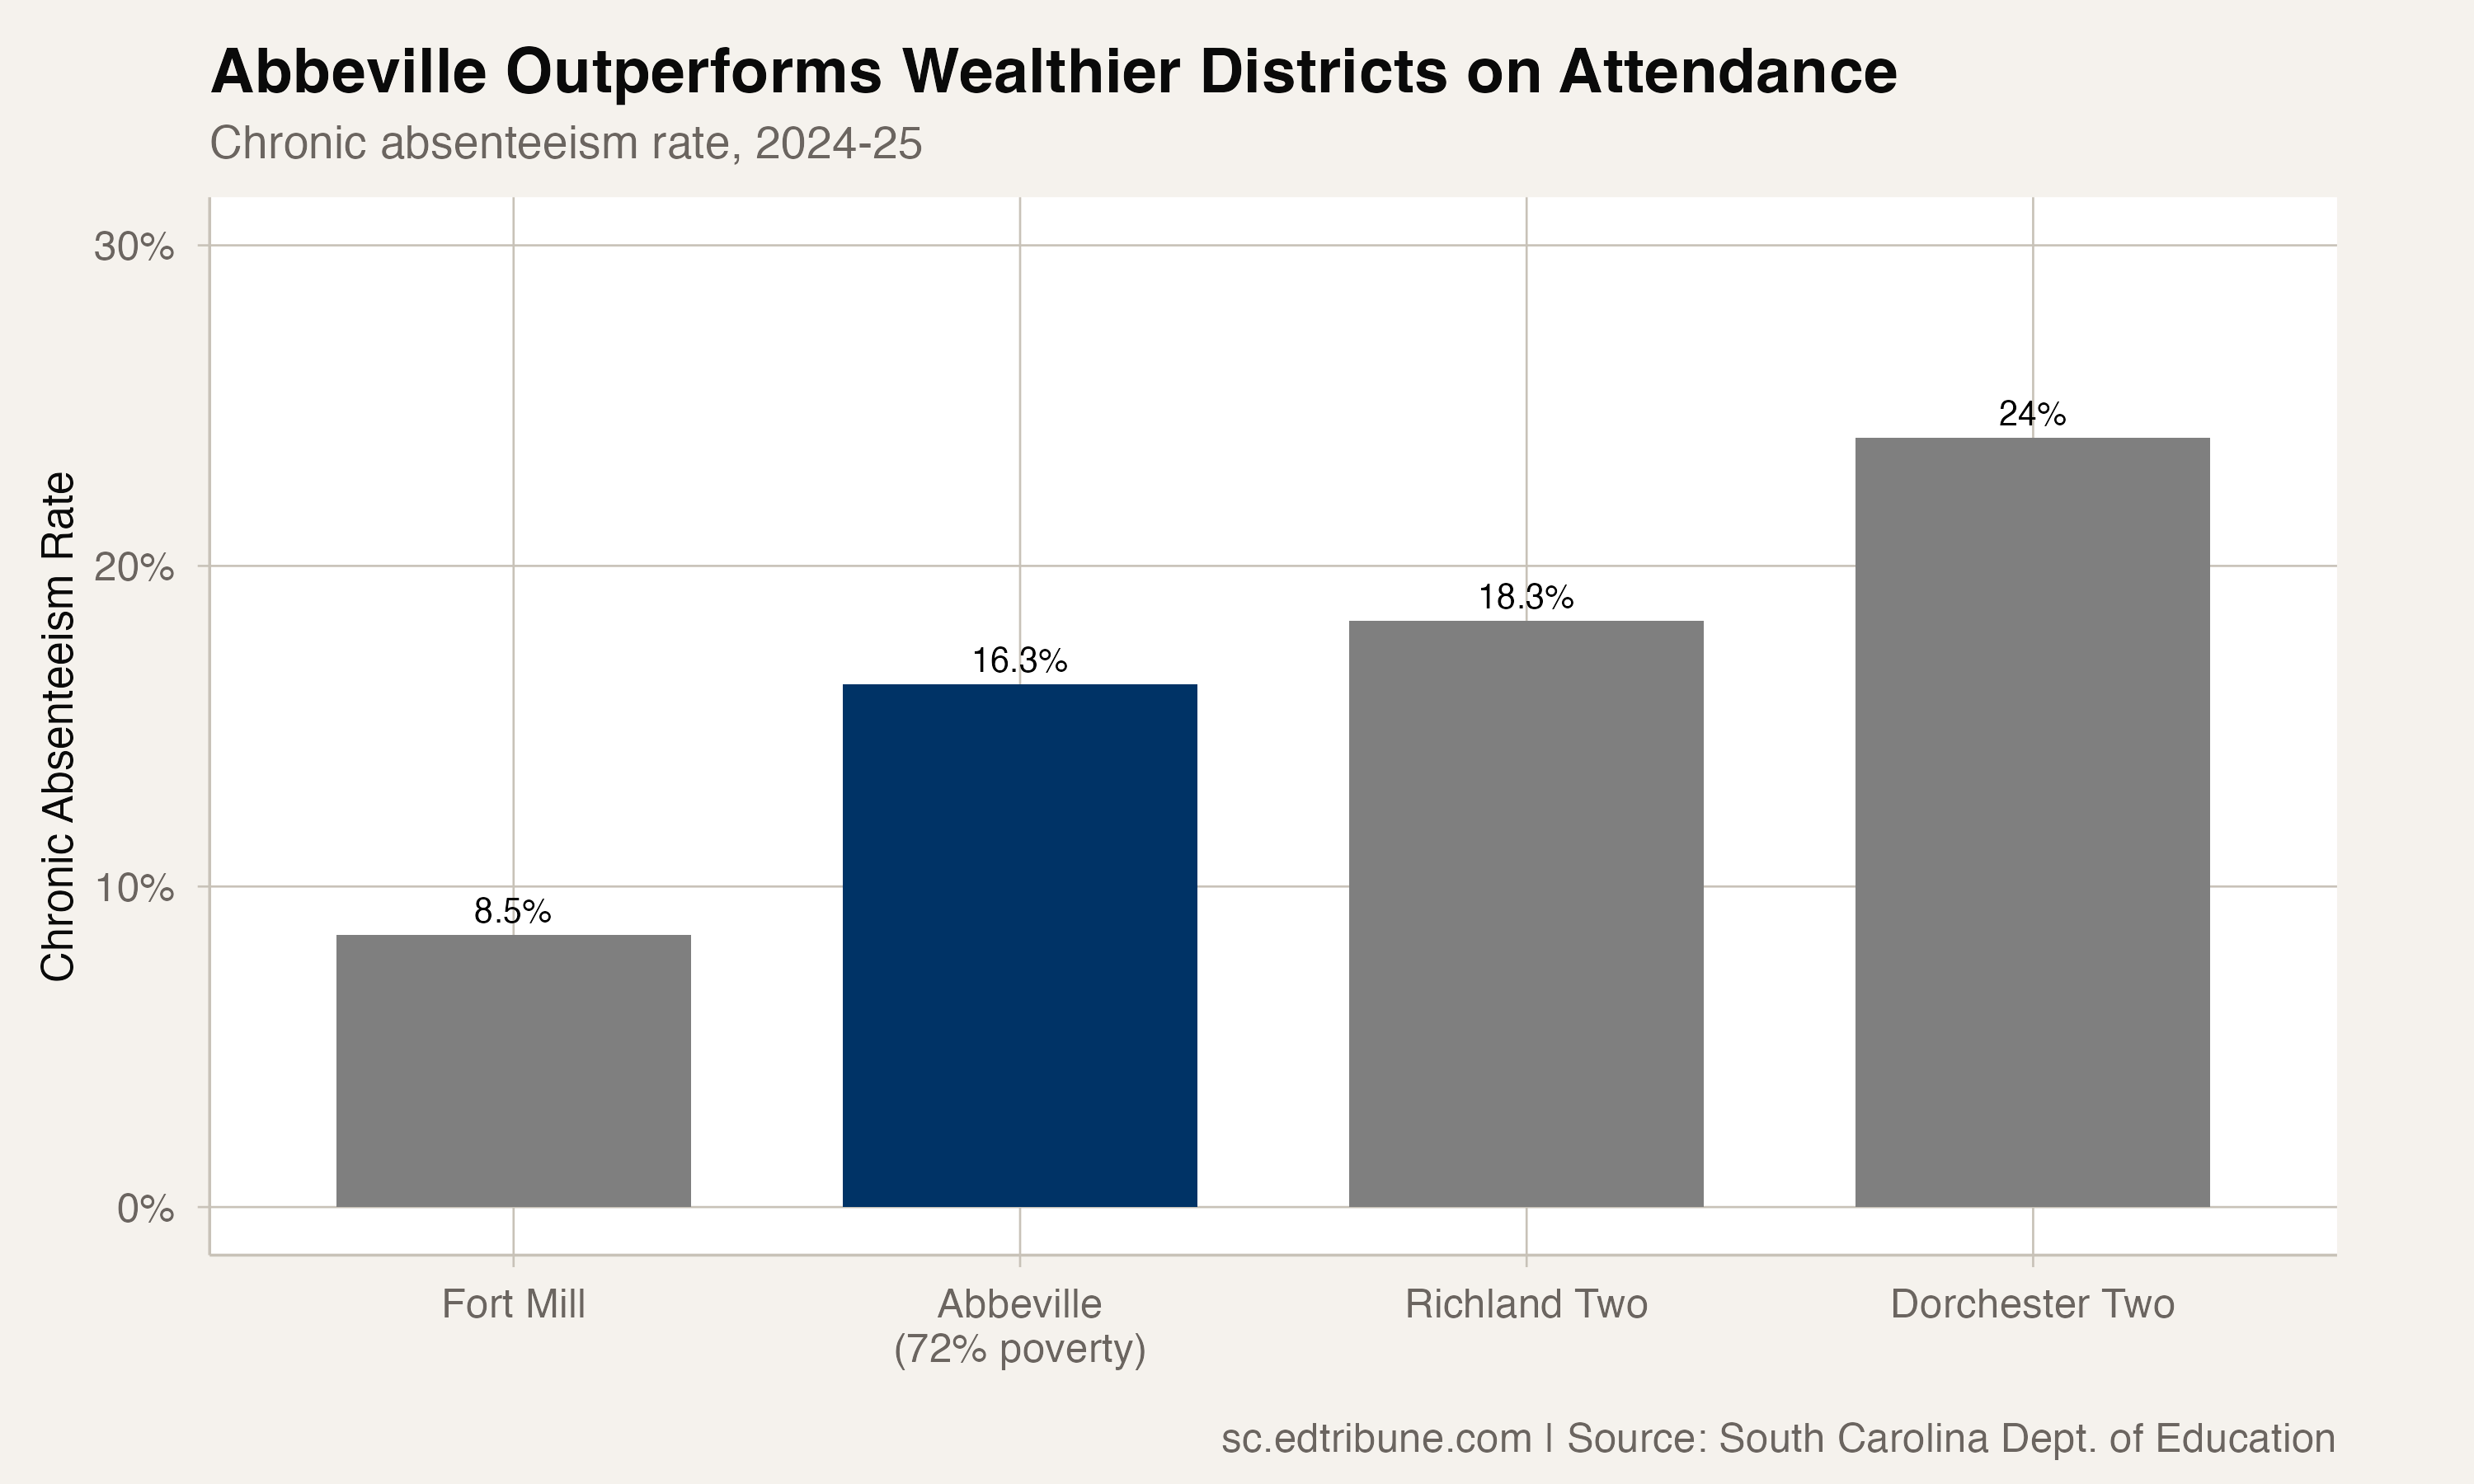
Dorchester Two, with roughly 24% economically disadvantaged students, has a chronic rate of 24.0%, nearly 8 points higher than Abbeville at 72% poverty. Richland Two, at about 64% poverty, is at 18.3%. Abbeville, with the highest poverty rate of the three, has the lowest chronic rate.
The only traditional district consistently outperforming Abbeville at any enrollment size is Fort Mill (8.5%), which has a 23% poverty rate. Among districts above 50% poverty, Abbeville's 16.3% is in the top tier statewide.
The Abbeville Paradox
There is a tension in what the data shows. Abbeville County is the namesake of a lawsuit arguing that the state's poorest districts cannot provide an adequate education. The district has received more than $38 million in state infrastructure funding as part of the legislative response. The argument, a powerful one with substantial evidence, is that poverty creates educational barriers that state funding must address.
The chronic absenteeism data complicates that narrative, at least on one metric. If poverty were destiny for attendance, Abbeville should be above 23% alongside its poverty-tier peers. Instead, it is at 16.3%. Something in the district (leadership, community culture, specific interventions, the small-district ability to know every family) is producing attendance outcomes that poverty predicts it should not.
Dr. Lori Brownlee-Brewton serves as superintendent. Under her leadership, the 2,853-student district is producing results that raise an uncomfortable question for larger, wealthier districts: if Abbeville can get to 16.3% at 72% poverty, what is the explanation for 24% at 24% poverty?
EdTribune has reached out to Dr. Brownlee-Brewton for comment and will update this article with any response.
Detailed code that reproduces the analysis and figures in this article is available exclusively to EdTribune subscribers.
Discussion
Sign in to join the discussion.
Loading comments...